(adsbygoogle = window.adsbygoogle || []).push({ google_ad_client: "ca-pub-4811569576492328", enable_page_level_ads: true }); Beyond The Technical Analysis Expended: Fundamental analysis Beyond The Technical Analysis Expended: Fundamental analysis
  • Beyond The Technical Analysis Expended
    “Education breeds confidence. Confidence breeds hope. Hope breeds peace.”
    Technical Analysis in called an art to forecast price movements.
    Understanding and having command on these absurd looking lines can make you richest man in the world.
    Welcome to my Technical Analysis Tutorial Blogs
Showing posts with label Fundamental analysis. Show all posts

How to read Balance Sheet for Fundamental Analysis


By looking at the balance sheet of the company one can understand how the company has build wealth for itself and its owners over the past years.
Balance sheet of a company makes one thing clear about the business, it talks about from where the company is generating funds to run its business, and where the company is using those funds.
Any company generate funds in three possible ways. It can borrow money from stock market. This is called share capital in balance sheet.
The company can also retain its net profits to run the business. This is called reserves and surplus in the balance sheet.
Company can also borrow funds from Bank etc. This is recorded as long term borrowing and short term borrowing in balance sheet.
Hence, the total funds available with a company to run its business can be summed up like this:
Total Funds = Share Capital + Reserves + Debt.
{Note: Share Capital + Reserves = Book Value.}
This (total funds) is also called the total liability of the company.
How the company uses their generated funds is also indicated in the balance sheet.
Company use its generated funds to build assets. These assets intern generate income for the company.
Let’s see the important constituents of a balance sheet in more detail.
Balance sheet basically defines this equation:

If one read a balance sheet statement of a company, it will show how much accumulated wealth the company has amassed till that day.
Shareholders fund (Book Value / Net Worth)
Why it is called as shareholders fund?
Shareholders fund is that money that companies owe to their shareholders.
Shareholders have a legal claim on the company’s net profits. Hence any funds that is retained by the company (Reserves) goes into the account of shareholders funds.
Company consider these funds as that money which they need to pay-back to the shareholders one day.
Book Value = Share Capital + Reserves
Share capital: is that money that the company has generated from its IPO.
Share capital is actually the borrowed money that the company has taken from the shareholders.
It is also treated as companies liability.
Reserves :are also referred as retained net profits of the company.
Why companies retain their profits? This is done to strengthen their balance sheet (financial position).
Companies used a reserves to buy new fixed assets. This day 2 by means of capital expenditure plans (CAPEX).
Companies also use their reserves to reduce there debt burden.
A portion of reserves is also used to pay dividends to its existing shareholders.
General there are two types of reserves. First, revenue reserve and second, is called capital Reserves.
Revenue reserves is again categorized into two types, first he is general reserves and second is specific reserves.
As the name suggests, general reserves is not apportioned for any specific purpose. They are just kept in the balance sheet to strengthen the financial position of the company.
Specific reserves are those portion of money which is kept for specific purpose. The the funds kept in the specific reserve shall be used only for the designated purpose.
How the reserves in the balance sheet is funded every year?
The annual profits of the company that is shown as net profit, in profit and loss account, is transferred to the company’s balance sheet as retained earnings.
This retained earning in turn is used as the reserves of the company.
If the company has made a loss in a particular financial year, no transaction is recorded in the reserves column of the balance sheet.
Sometimes, in case of loss, the company may even debit there reserves account in balance sheet to meet their requirements.
In such case one will find a dip in the reserves and surplus account as compared to the previous year.
One of the most important financial indicator detailed in the Balance Sheet is shareholders equity. In doing a balance sheet analysis it plays an important role.
Net worth of a company is equal to total capital generated by the company by issuing stocks and accumulated retained earnings.
A continuously improving net worth is what investors likes to see in companies balance sheet.
Investors must compare last five years net worth of the company, and must also check growth rate.
It is important to check how the net worth of company has grown.
If increase in net worth is attributable only to the issuance of more stocks to public, then it is not good.
Ideally, the companies net worth must increase due to growth in retained earnings.
Liability
Non current liabilities
Non current liabilities are those liabilities of a company which is settled only after 12 months from the date of reporting.
These are such liabilities that company need not settle immediately.
If you will see in moneycontrol.com, you will find that non current liabilities are mainly recorded in two three some heads. First he’s long term borrowing. Second, is deferred tax liability and third is long term provisions.
Companies which show the line item has long term borrowing, means that the company has taken that from the market (mainly banks).
It is very important for the shareholders to keep a note of how high is the long term borrowings of the company as compared to its equity.
Deferred tax liability is a provisional fund maintained by the company using which they will pay the forthcoming additional tax dues.
Has a part of non current liability the company also hello kids some funds in the name of long term provisions. Here the company keeps some cash reserves for paying their employees. These payments can be like gratuity, provident funds, leave encashment. The provisions can also be made for income tax payment, payment of dividend to shareholders, dividend distribution tax etc.
Current liabilities
Current liabilities are those obligation of the company that they must meet before 12 months.
If you will look into balance sheet of any company in moneycontrol.com you will find four line items under the heading current liabilities. They are, short term borrowing, trade payables, other current liability and short term provisions.
Short term borrowing is essentially that loan that company has taken from Bank CTC to fund there day-to-day cash flow requirement. In financial term this is also called as working capital of the company.
Trade payable is that money that a company must pay to its suppliers within next 12 months.
Short term provisions are again similar to long term provisions. The only difference here he is, this provisions me get used within next 12 months.
Assets
Generally in the balance sheet, assets are categorised into two main types: non-current assets and current assets.
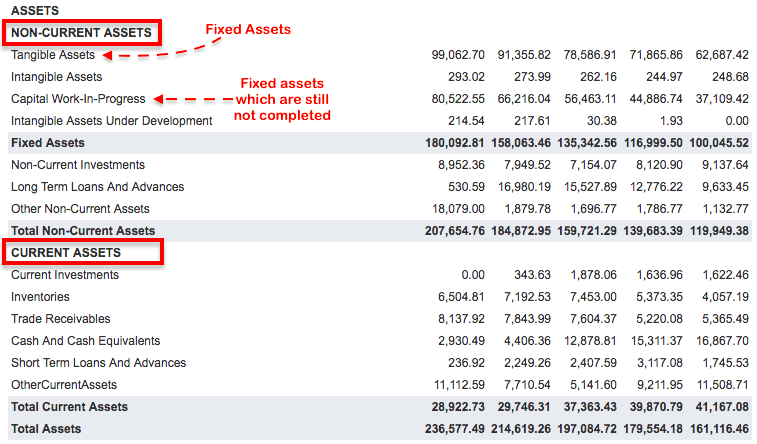
Non-current assets are basically property, plant, and equipment’s of the company. Normal terms we call it as fixed assets of the company (Tangible assets).
Fixed Assets (Tangible Assets)
Fixed assets adults assets of the company which they use directly for the production of goods and services for their customers.
Common examples of fixed assets are land, factory buildings, machines, furniture’s, Motor vehicles etc.
Fixed assets are those assets of the company which company gathers to hold them for long-term.
Contrast to the fixed assets, an inventory is also an asset of the company. But company maintains the inventory with the objective of selling them in near future.
Intangible assets
Assets of the company do not have a physical substance. You cannot physically see it and touch it. Example off in tangible assets can be like copyrights, trademarks, patents etc gathered by the company over a period of time.
Capital work in progress
These are those assets which were not ready at the time of preparation of the balance sheet. These are those assets which are still not ready to produce goods and services for the company.
Hence, call costs that has gone into the preparation of that as it is shown as capital work in progress off the companies balance sheet.
Just to understand, let’s take a small example. Pause cement manufacturing plant is putting up a new facility to manufacture a new brand of cement. Average it may take 3 years for the company to start production from this new facility. But the company will start spending money on this asset from the first months itself. So, the cost that was into the preparation of the new cement plant will be booked as capital work in progress for the next three years.
As soon as the new plant will begin production, all capital work in progress associated with this new plant will be transferred as tangible asset.
Non-current investments
Current investments are those investments made by the company which day would like to hold for more then next 12 months. Example of such an investment can be stockholding of another company.
Generally current investments are reported in the balance sheet equivalent to the market valuation of the investment.
Current assets
Current assets are those assets of the company which is expected to be converted into cash within next one year.
It is the current assets of the company that helps them to maintain enough liquidity.
Current assets of the company helps in management of the current liabilities.
One of the most reliable firms of current assets cash and cash equivalent, inventory, it’s investments, account receivables from its customers, and loans and advances given to associates/ suppliers. Advances are also referred to as pre-paid expenses in some balance sheets.
To Conclude

You can see the above snapshot of a typical balance sheet of a company and understand what is actually balanced in a balance sheet.
Total asset of a business is always equal to the sum of its total liability and shareholders funds.
How balance sheet is related with its profit and loss accounts?
Reserves & Surplus in balance sheet gets updates every time the company makes net profit (PAT). Net profit appears in companies profit and loss accounts.
Debt (long term and short term borrowings) in balance sheet increases the companies Finance cost which appears in companies profit and loss accounts.
Trade payables of the balance sheet is a portion of expense to be incurred by the company in the next financial year (FY). Companies often buy goods and services from the suppliers on credit. All expenses which are booked by the company appears in the profit and loss accounts.
Tangible assets valuation appearing in balance sheet are recorded as net of accumulated depreciation (over last several years of operation). Depreciation applicable only for a particular FY, appears in the companies profit and loss accounts.
Non-current and current investments made by the company is recorded in companies balance sheet. The income generated by these investments are recorded as other income in profit and loss accounts.
Trade receivables appearing in balance sheet of the company is the out of sales revenue. Companies often sell their products and services to their customers on credit. This credit payment due, to be paid by next months are recorded as trade receivable.

So now you can understand well, how balance sheet and profit and loss accounts communicate with each other.


Disclaimer: All blog posts of https://nse-bse-mcx-technicalanalysis.blogspot.com/ are for information only. No blog posts should be considered as an investment advice or as a recommendation. The user must self-analyze all securities before investing in one.
Read more »

How to analyze the company before investing - Fundamental Analysis

How to analyze the company before investing


= What is Fundamental Analysis
= Invest in Good Company
= Earnings
= Current Valuations of the Shares
= Future Earnings Growth
= Debit status of the Company
 
= What is Fundamental analysis?

Fundamental analysis is basically done for long term and mid term investment which is also called as delivery based investment or trading.
The main important aim behind is to study and understand the company in which you are planning to invest your hard earned money and get excellent returns.

How to analyze the fundamentals of the company?
Basically one should be able to judge at least how the company has done in past years, its debit status, its current valuation, its future growth prospects, its earning capacity etc 
So that based on these terms he can at least decide whether to invest in this company or not.


= What you should look for in a company to invest?

1. About Company
 - 
What the company is doing and what are its businesses?
How is the current demand for their products and how the demand will be in future like in next 3 to 5 years and so? (It is difficult to analyze the future demand yourself so you can visit financial websites or contact us)

2. Earnings - 
This is very important parameter. Broadly look into its last 5 or 10 years earnings whether the company has posted profits or losses.
It’s all about earnings. The bottom line is investors want to know how much money the company is making and how much it is going to make in the future. 
To find the earning status ratios used are EPS - Earning per share

3. Current valuation
 - 
This is another very important factor which most of the investor forgets while doing their investments. 
Generally most of the investors invest at higher valuations of shares and when share prices start coming down then they keep worrying, so this should not happen.
Before investing one should check the current valuation of the share price and invest only when the share price is at right price and not at over priced share.
This is what happened in January 2008. Most of the people invested at very high valuations and later on the share prices started to correct (falling down).
To find the current valuation of the stock the ratios used are 
PE ratio - Price to earning ratio
Book value 
PB ratio - Price to book value ratio

4. Future earnings growth -
It is very important to analyze how the company is going to do in future. How will be its returns or its profits etc?
Basically most of the investors invest in shares taking into consideration Company’s future growth prospects.
To find the future growth of the stock the ratios used are 
PEG ratio - Price to earning growth ratio
Current EPS and Forward EPS
Price to sales ratio


5. Debit status
 - 
For any company to perform well in the future it is very important to be debt free or less debit because if company is having large debits like borrowings, loans then it becomes difficult for it to plan for any acquisitions, expansion plans take over plans, dividend   payout and very important its most of the net profit goes in paying the interest and loans and other debits.
So in other words if the company is having fewer debits or no debit then they are having lots of cash in hand and they are free to take any decision in coming future.
To find the debit status of the company the ratios used are 
Debit ratio

So to accomplish above parameters fundamental analyst follow certain ratios which are mentioned below.
 
= Earnings

Earning Per Share - EPS
EPS plays major role in investment decision. 
EPS is calculated by taking the net earnings of the company and dividing it by the outstanding shares. 

EPS = Net Earnings / Outstanding Shares 
(Nowadays you will get this ready made, no need for you to do calculation.)

For example - 
If Company A had earnings of RS 1000 crores and 100 shares outstanding, then its EPS becomes 10 (RS 1000 / 100 = 10). 
Second example - 
If Company B had earnings of RS 1000 crores and 500 shares outstanding, then its EPS becomes 2 (RS 1000 / 500 = 50). 

So what is that you have to look in EPS of the company?
Answer - You should look for high EPS stocks and the higher the better is the stock.

Note - You should compare the EPS from one company to another, which are in the same industry/sector and not from one company from Auto sector and another company from IT sector. 

Before we move on, you should note that there are three types of EPS numbers: 

Trailing EPS - Trailing EPS means last year’s EPS which is considered as actual and for ongoing current year.

Current EPS
 - Current EPS means which is still under projections and going to come on financial year end.

Forward EPS
 - Forward EPS which is again under projections and going to come on next financial year end

But the EPS alone doesn’t tell you the whole story of the company so for this information, we need to look at some more ratios as following.
It’s not advisable to make your investment decisions based on only single ratio analysis.
EPS is the base for calculating PE ratio.

Importance of Earnings -
Earnings are profits. Quarterly or yearly company’s increasing earnings generally makes its stock price move up and in some cases some companies pay out a regular dividend. This is Bullish sign and indicates that the company’s is in growth.

When the company declares low earnings then the market may see bearishness in the stock price and hence its share price starts deceasing and corrects further if the company doesn’t provide any sufficient justification for low earnings.
  
Every quarter, companies report its earnings. There are 4 quarters. 

Quarter 1 - (April to June and earnings will be declared in July)
Quarter 2 - (July to Sept and earnings will be declared in Oct)
Quarter 3 - (Oct to Dec and earnings will be declared in Jan)
Quarter 4/final - Also called as financial year end - (Jan to Mar and earnings will be declared in April)

Now by this time you would have understood how earnings are important for a stock price to move up or down. But depending only on earnings one should not make investment or trading decision. To make decision more risk free you should look into more tools as mentioned below so that your investment decision becomes more solid and you should get excellent returns in future. 

Conclusion - Keep a close watch on quarterly earnings and trade or invest accordingly or manipulate your investing.

Following are the most popular and important tools/ratios to find excellent growth stocks which focuses on earning, growth, and value of the company’s. 
To make you understand more easily we have explained in very simple steps.

= Current Valuations of the shares

Price to Earnings Ratio - PE ratio
PE ratio is again one of the most important ratio on which most of the traders and investors keep watch. 
Important - The PE ratio tells you whether the stock’s price is high or low compared to its forward earnings. 
The high P/E suggests that investors are expecting higher earnings growth in the future compared to companies with a lower P/E. This generally happen in bull market and share price keeps on increasing. Basically in bull market share prices keep increasing without giving more importance to its current valuation and once market realizes that it is over priced then they start selling.
In bear market the low PE stocks having high growth prospects are selected as best investment options.

But, the P/E ratio doesn't tell us the whole story of the company.
Generally the P/E ratios are compared of one company to other companies in the same sector/industry and not in other industry before selecting any particular share.

The PE ratio is calculated by taking the share price and dividing it by the companies EPS.
That is 
PE = Stock Price / EPS 

For example
A company with a share price of RS 40 and an EPS of 8 would have a PE ratio of 5 
(RS 40 / 8 = 5). 

Importance - The PE ratio gives you an idea of what the market is willing to pay for the companies earning. 
The higher the P/E the more the market is willing to pay for the companies earning. 
Some investors say that a high P/E ratio means the stock is over priced on the other side it also indicates the market has high hopes for such company’s future growth and due to which market is ready to pay high price. 
On the other side, a low P/E of high growth stocks may indicate that the market has ignored these stocks which are also known as value stocks. Many investors try finding low P/E ratios stocks of high value growth companies and make investments in such stocks which may prove real diamonds in future.

Which P/E ratio to choose?  
If you believe that the companies has good long term prospects and good growth then one should not hesitate to invest in high P/E ratio stocks and if you are looking for value stocks which prove real diamonds in future then you can go with low PE stocks provided that companies has good growth and expansions plans.
At all if you would like to do PE ratio comparison then it has to be done in same sectors/industry stocks and not like one stock from banking sector and other stock from pharmacy sector.
So now you would have come to know how to choose stocks based on PE ratio.

What is book value?
Book value is the total value of the company's assets that shareholders would theoretically receive if a company were liquidated (closed).
By being compared to the company's market value, the book value can indicate whether a stock is under priced or overpriced.
So in other words if the share price is trading below its book value then it is considered as under priced and good for value investing.

Price to Book Ratio - PB ratio
Basically PB ratio is mostly utilized by smart investors to find real wealth in shares, so investing in stocks having low PB ratio is to identify potential shares for future growth.

A lower P/B ratio could mean that the stock is undervalued.

Like the PE, the lower the PB, the better the value of the stock for future growth. 

Some of the investors become quite wealthy by holding stocks for the long term of such companies whose growth is based on their businesses instead of market and one day when every one notices this stock the value investor’s pockets are full of profit. 

PB ratio is calculated as 
PB ratio = Share Price / Book Value per Share.

Generally, if the ratio comes below 1 then it is considered as value investing. But this doesn’t mean that the ratio coming to 1.2 or 1.5 is not value investing. It also depends on its future growth prospects.

= Future earnings growth

Projected Earning Growth ratio - PEG ratio
Because the market is usually more concerned about the future than the present, it is always looking for companies projected plans, financial ratios, and other future announcements. 

The use of PEG ratio will help you look at future earnings growth of the company.

PEG is a widely used indicator of a stock's potential value.
Similar to the P/E ratio, a lower PEG means that the stock is more undervalued.

To calculate the PEG the P/E is divided by the projected growth in earnings. 

That is PEG = P/E / (projected growth in earnings) 

For example - 
A stock with a P/E of 30 and projected earning growth for next year is 15% then that stock would have a PEG of 2 (30 / 15 = 2). 
In above example what does the “2” mean? 

Lower the PEG ratio the less you pay for each unit in future earning growth. So the conclusion is you can invest in high P/E stocks but the projected earning growth should be high so that companies can provide good returns. 

Looking at the opposite situation; a low P/E stock with low or no projected earnings growth is not going to give you good returns in future because its PE is low means investors are not ready to pay high and its PEG is also low because companies do not have any good future growth or expansion plans so investment in such stocks could prove less or no returns.

A few important things to remember about PEG:
It is about year-to-year earnings growth. 
It relies on projections, which may not always be accurate.
It’s forward earning estimation which market analyst or company calculates. 

Following two ratios are again the projection or estimation done by either market analyst or by company resources.

Current EPS
 - Current EPS means which is still under projections and going to come on financial year end.

Forward EPS
 - Forward EPS which is again under projections and going to come on next financial year end.


Price to Sales Ratio
The question is, is it that companies having no current earnings are bad investments? 
Answer is Not necessarily, because such companies may be new and trying to grow and expand but you should approach such companies with precaution.

The Price to Sales (P/S) ratio looks at the current stock price relative to the total sales per share. 

You can calculate the P/S by dividing the market cap of the company by the total revenues of the company. 

You can also calculate the P/S by dividing the current stock price by the sales per share. 

That is 
P/S = Market Cap / Revenues 
or 
P/S = Stock Price / Sales Price per Share 

Conclusion - To find under valued stocks you can look for low P/S ratios.

The lower the P/S ratio the better is the value of the company. 

= Debit status of the Company

Debit Ratio

This is one the very important ratio as this tells you how much company relies on debit to finance its assets.
The higher the ratio the more risk for company to manage going forward. So look for company’s having low debit ratio. 
Generally it is considered that debit ratio less then 1is good investment option. But even some investor considers higher debit ratio provided the company is having good growth prospects.

If company has fewer debits then company can make more profit instead paying for its debits like interests rates, loans etc.

Dividend Yield
If you are a value investor or looking for dividend income then you should look for Dividend Yield figure of the stock.
This measurement tells you what percentage return a companies pays out to shareholders in the form of dividends. Older, well-established companies tend to payout a higher percentage then do younger companies and their dividend history can be more consistent. 

You calculate the Dividend Yield by taking the annual dividend per share and divide by the stock’s price. 
That is 
Dividend Yield = annual dividend per share / stock's price per share 

For example
If a company’s annual dividend is RS 1.50 and the stock trades at RS 25, the Dividend Yield is 6%. (RS 1.50 / RS 25 = 0.06). 

Important Note
 - Any single tool or ratio should not be used to make your investment or trading decision nor will they provide you any buy or sell recommendation. All tools should be used to find growth and value stocks. 
After making use of above all tools you will get excellent stocks which will give you excellent returns in mid term to long term. 
You will find all these ratios in any financial website or you can contact us.

Final and last - very important
Check out company’s PAT (profit after tax) of every quarterly if you are short term to mid term trader and if you are long term investor then check out its yearly PAT. The company should have posted consistent growth.


Read more »
 
SORRY ADBLOCKER DETECTED
It looks like you're using an ad blocker. That's okay. Who doesn't?
But without advertising-income, we can't keep making this site awesome.
Please disable your ad blocker and then reload the page to continue enjoying our site.
Reload Page
Beyond The Technical Analysis - Contact