(adsbygoogle = window.adsbygoogle || []).push({ google_ad_client: "ca-pub-4811569576492328", enable_page_level_ads: true }); March 2014 March 2014 Beyond The Technical Analysis Expended -An Exclusive Indian Stock, Commodity Market Technical Analysis Tutorial Blog. Getting started in Our Technical Analysis Course.
  • Beyond The Technical Analysis Expended
    “Education breeds confidence. Confidence breeds hope. Hope breeds peace.”
    Technical Analysis in called an art to forecast price movements.
    Understanding and having command on these absurd looking lines can make you richest man in the world.
    Welcome to my Technical Analysis Tutorial Blogs

Basic knowledge of risk management

Basic knowledge of risk management

Every investment is subject to risk due to potential unfavorable price changes. As the financial markets constitute a complex system with many factors influencing the demand and supply at the same time, it is important to know that the result of practically any given transaction is uncertain.


Risk management depends very much on the types of assets the trader is interested in. In this text we would like to discuss the tools that can be used in order to minimize potential losses resulting from adverse price changes:
  • study the different types of assets
  • plan your strategy
  • establish the maximum acceptable risk
  • use the different order types.
 
Study the different types of assets
It is crucial to first understand the liquidity.
 
Depending on the type of asset you are interested in, there may be more or less volatility related. The higher  the volatility, the higher the financial risk associated with the given market. This means that operating on a such market involves potentially higher profits and losses than in the case of markets with lower volatility. There are markets where there is not much movement, while others change very often and the price changes may be quite significant.
 
Another important issue is the spread - i.e. the difference between the ask price and bid price. Different assets have different spreads, as the spread size depends on such factors as liquidity of the market, its volatility or time of the day. As the spread represents an indirect cost of the transaction for  a trader, it can be related to the volatility in order to compare the cost of transaction between the given markets. For example, the cost of operating on  a market where the spread is 4 points and the difference between daily maximum and minimum is equal to 60 points, can be considered to be more attractive than in the case of a market where the spread is 2 points, but the daily price range is just 20 points.

Plan your strategy
It is imperative to decide what type of investment strategy is to be implemented
 
The strategy shall define the key aspects of the trades, including their time horizon. There are assets where it is difficult to trade in the short term, as the cost of transaction is relatively high in relation to the size of  typical price movements. However, it is still possible to consider such markets for the purposes of investment in the longer term, cost carry transactions or possible arbitrage. On the other hand, assets that change very often could provide a good possibility for transactions in the short and ultra short term.
 
 
Establish the maximum acceptable risk for an investment or trade
 Important step that many investors seem to ignore
 
It may be a good idea to establish a maximum amount of money that he/she is willing to risk in any given transaction. Such an amount can be defined as a percentage of the available capital. Considering an example where the trader is willing to risk no more than 3% of the portfolio, 3% of that amount would mean that the investor is willing to “risk” no more than $300 USD in a trade.
 
The limit calculated as shown above, or using any other method, can be taken into account when considering where to set the stop loss or close the transaction by any other means. In order to do that, one should also consider a value of  pips. Assuming that for a specific asset the pips value is equal to $10 USD, and the acceptable risk is $300 USD, then a trader may consider placing a stop-loss with a value of 300/10 = 30 pips from the level where the transaction  was opened.
 
Use the different orders.
Understanding the possibilities behind the pending orders of the trading platform may contribute to more efficient trading plan
 
There are many different orders available at the MT5, which can potentially help to realise profits or limit the losses during the investment process:
  • Market orders - buy/sell
  • Stop loss
  • Take profit
 
Market orders (or instant execution orders): these are simply orders (buy or sell) that are executed instantly  at the  time they are placed.
 
Stop-loss: stop-loss orders are additional orders available for both pending orders and market orders. They can also be attached to already opened positions on  a given market. These types of orders are the most basic orders designated for limiting the potential losses, for  example when an investor is not able to follow prices all the time. A trader establishes stop-loss levels by either specifying the level in points from the current price or by specifying an exact price level. For long positions, the stop-loss value must be lower than the current price. For short positions, the stop-loss value must be higher than the current price.
 
Take-profit: Take profit is an additional order available for both pending orders and market orders. They can also be attached to already opened positions on  a given market. The difference between this order and the stop-loss order is that in the take-profit order, a trader will fix the exact profit he wants to realise. Sometimes, investors are not actually sure how much a price will continue its direction, so they fix a value for which a profit is guaranteed if the price reaches that level. For long positions, the take-profit level must be above the current price. For short positions, the take-profit level must be lower than the current price. 
 
Pending orders: Pending orders will be placed immediately but executed only when the price has reached a previously determined price. There are six types of
orders available as pending orders:
  • Buy limit
  • Sell limit
  • Buy stop
  • Sell stop
  • Buy stop limit
  • Sell stop limit
Buy limit: an investor is willing to buy an asset when the price has reached a certain level.  At the  time of placing of  an order the market price must be higher than the one specified as the buy limit price. In this situation, investors believe that prices will fall to a certain level and will later rise.
 
Sell limit: an investor in this case is willing to sell an asset when the price has reached a specified level. At the  time of placing  an order, the market price must be lower than the one specified by the investor (sell limit price). This approach reflects the belief of the trader that prices will reach a certain level (the sell limit price level) and then start falling.
 
Buy stop: by placing a buy stop order an investor expects that if prices reach a certain level (buy stop price), they will keep on rising. The price at which the transaction  is concluded will be less favourable than the current market price. However , the fact of reaching that level could be interpreted as a confirmation signal. Once executed, this order will buy an asset after reaching a level defined by the investor. The market price at the time of placing the order must be lower than the defined buy stop level.
 
Sell stop: by placing a sell stop order a trader expects the prices to keep on falling, once a certain level (sell stop price) below the current market price  is reached. Reaching this level can also be interpreted as a confirmation order of the investor’s prediction. Once executed, this order will sell an asset after reaching a level previously established by the trader. The market price at the time of placing the order must be higher than the defined sell stop level.
 
Buy stop limit: It is combines both buy stop and buy limit features. This order will place a pending order (buy limit order) only if the price previously reaches a defined price by the investor. One may say that this is a conditional pending order, that will only be executed when the price reaches a certain level. To place this order the current price must be lower than the conditional price level - i.e. the price which activates the pending order.
 
Sell stop limit: This is a conditional pending order. An order will be placed if and only if a price reaches a price level previously defined by the investor. To place this conditional order, the current market price level must be higher than the conditional price. Once  prices start falling and reach the conditional price level a new sell limit order will be placed.

Read more »

Harmonic Pattern

HARMONIC PATTERNS

Harmonic price patterns take geometric price patterns to the next level by using Fibonacci numbers to define precise turning points. Unlike other trading methods, Harmonic trading attempts to predict future movements. This is in vast contrast to common methods that are reactionary and not predictive. Let's look at some examples of how harmonic price patterns are used to trade on the market. (Extensions, clusters, channels and more! Discover new ways to put the "golden ratio" to work.
Combine Geometry and Fibonacci Numbers
Harmonic trading combines patterns and math into a trading method that is precise and based on the premise that patterns repeat themselves. At the root of the methodology is the primary ratio, or some derivative of it (0.618 or 1.618). Complementing ratios include: 0.382, 0.50, 1.41, 2.0, 2.24, 2.618, 3.14 and 3.618. The primary ratio is found in almost all natural and environmental structures and events; it is also found in man-made structures. Since the pattern repeats throughout nature and within society, the ratio is also seen in the financial markets, which are affected by the environments and societies in which they trade. (Don't make these common errors when working with Fibonacci numbers - check out
Top Fibonacci Retracement Mistakes To Avoid) By finding patterns of varying lengths and magnitudes, the trader can then apply Fibonacci ratios to the patterns and try to predict future movements. The trading method is largely attributed to Scott Carney, although others have contributed or found patterns and levels that enhance performance.
Issues with Harmonics
Harmonic price patterns are extremely precise, requiring the pattern to show movements of a particular magnitude in order for the unfolding of the pattern to provide an accurate reversal point. A trader may often see a pattern that looks like a harmonic pattern, but the Fibonacci levels will not align in the pattern, thus rendering the pattern unreliable in terms of the Harmonic approach. This can be an advantage, as it requires the trader to be patient and wait for ideal set-ups.

Harmonic patterns can gauge how long current moves will last, but they can also be used to isolate reversal points. The danger occurs when a trader takes a position in the reversal area and the pattern fails. When this happens, the trader can be caught in a trade where the trend rapidly extends against them. Therefore, as with all trading strategies, risk must be controlled.

It is important to note that patterns may exist within other patterns, and it is also possible that non-harmonic patterns may (and likely will) exist within the context of harmonic patterns. These can be used to aid in the effectiveness of the harmonic pattern and enhance entry and exit performance. Several price waves may also exist within a single harmonic wave (for instance a CD wave or AB wave). Prices are constantly gyrating; therefore, it is important to focus on the bigger picture of the time frame being traded. The fractal nature of the markets allows the theory to be applied from the smallest to largest time frames.
To use the method, a trader will benefit from a chart platform that allows the trader to plot multiple Fibonacci retracements to measure each wave.

The Visual Patterns and How to Trade Them 

There is quite an assortment of harmonic patterns, although there are four that seem most popular. These are the Gartley, butterfly, bat and crab patterns.

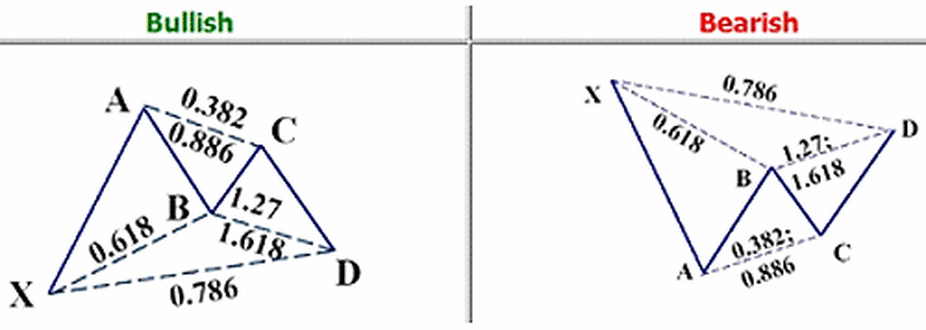
GARTLEY PATTERN

The Gartley was originally published by H.M. Gartley in his book Profits in the Stock Market and the Fibonacci levels were later added by Scott Carney in his book The Harmonic Trader. 
Figure 1: The Gartley Pattern.
 The bullish pattern is often seen early in a trend, and it is a sign the corrective waves are ending and an upward move will ensue at point D. All patterns may be within the context of a broader trend or range and traders must be aware of that (see Elliott Wave Theory). Point D is a 0.786 correction of the XA wave, and it is a 1.27 or 1.618 extension of the BC wave. The area at D is known as the potential reversal zone (PRZ). This is where long positions could be entered, as some price confirmation of reversal is encouraged. A stop is placed just below the PRZ.
More About  Bullish / Bearish Gartley Pattern.
Bearish Gartley 
The bearish gartley pattern formation is similar to head and shoulders pattern, but as you can see the point C is below the point A, hence it is not head and shoulder pattern. 

Formation and trading strategy of Bearish Gartley pattern:


  1. Point B must retrace 61.8% of AX movement.
  2. Point C must retrace anywhere from 38.2% to 88.6% of BA movement.
  3. Point D must be 138.2% or 161.8% extension of the BC movement.
  4. Point D must retrace 76.8% of AX movement. This is our selling area.


Bullish Gartley 
The bullish pattern is as seen below, its formation is quite similar to inverse head and shoulders pattern, but as you can see below point C is not on the same level as point A.

Formation of Bullish Gartley pattern and trading strategy:

  1. Point B can retrace 61.8% of XA movement.
  2. Point C can retrace anywhere from 38.2% to 88.6% of AB movement.
  3. Point D can be 138.2% or 161.8% extension of the CD move.
  4. Point D can retrace 76.8% of XA movement. Point D is our buying area.
Stop loss in this is always very strict and hence we get very cool risk reward ratio, many times around 1:5 or more. The very important reason for trading this pattern is that it is based on uncertain places where traders are most afraid to take positions, hence giving better meaning for risk.

Butterfly Pattern

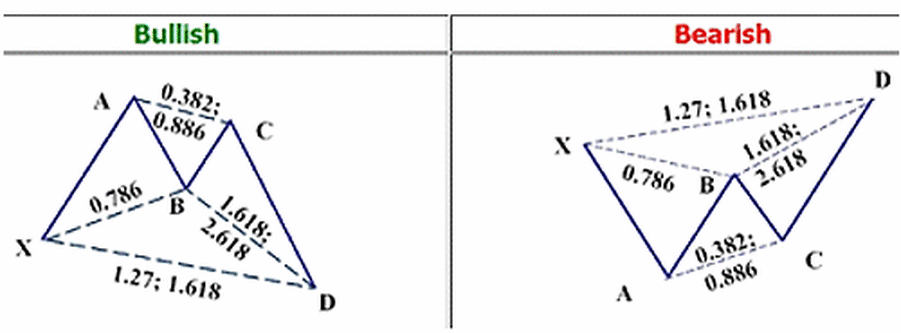
Figure 2: The Butterfly Pattern

The butterfly pattern is different than the Gartley in that it focuses on finding reversals at new lows (bullish) or new highs (bearish). D is a new low and a potential reversal point if the Fibonacci figures align with the structure. D would need to be an extension of BC in the magnitude of 1.618 or 2.618. This should align with an extension of XA in the magnitude of a 1.27 or 1.618. Entry is taken near D with price confirmation of the reversal encouraged. Stops are placed slightly below the potential reversal area (bullish). 

Bat Pattern

Figure 3: The Bat Pattern
The bat pattern is similar to Gartley in appearance, but not in measurement. Point B has a smaller retracement of XA of 0.382 or 0.50 (less than 0.618), but the extension of the BC wave into D is at minimum 1.618 and potentially 2.618. Therefore, D will be a 0.886 retracement of the original XA wave. This is the PRZ: when selling has stopped and buying enters the market, enter a long position and take advantage of the bullish pattern. Place a stop just below the PRZ.

Crab Pattern

Figure 4: The Crab Pattern

The crab is considered by Carney to be one of the most precise of the patterns, providing reversals in extremely close proximity to what the Fibonacci numbers indicate. This pattern, similar to the butterfly, looks to capture a high probability reversal at a new (recent) low or high (bullish or bearish respectively). In a bullish pattern, point B will pullback 0.618 or less of XA. The extension of BC into D is quite large, from 2.24 to 3.618. D (the PRZ) is a 1.618 extension of XA. Entries are made near D with a stop-loss order just outside the PRZ.


Fine-Tuning Entries and Stops
 
Each pattern provides a PRZ. This is not an exact level, as two measurements - extension or retracement of XA - creates one level at D and the extension of BC creates another level at D. This actually makes D a zone where reversals are likely. Traders will also notice that BC can have differing extension lengths. Therefore, traders must be aware of how far a BC extension may go. If all projected levels are within close proximity, the trader can enter a position at any area. If the zone is spread out, such as on longer-term charts where the levels may be 50 pips or more apart, it is important to wait to see if the price reaches further extension levels of BC before entering a trade.

Stops can be placed outside the largest potential extension of BC. In the crab pattern, for example, this would be 3.618. If the rate reversed before 3.618 was hit, the stop would be moved to just outside the closed Fibonacci level to the rate low (bullish pattern) or rate high (bearish pattern) in the PRZ.

Figure 5 is an intra-day example of a butterfly pattern from May 3, 2011.

Figure 5. Bearish Butterfly Pattern - EUR/USD, 15 Minute
 The price touches almost exactly the 1.618 extension level of XA at 1.4892 and the extension of BC to 2.618 is very close at 1.4887 (there are two Fibonacci tools used, one for each wave). This creates a very small PRZ, but it may not always be the case. Entry is taken after the rate enters the zone and then begins to retreat. The stop is placed just outside the most significant level that was not reached by the rate, in this case a few pips above the 1.618 XA extension. Targets can be based on support levels within the pattern; therefore, an initial profit target would be just above point B.

 The Bottom Line
 
Harmonic trading is a precise and mathematical way to trade, but it requires patience, practice and a lot of study to master the patterns. Movements that do not align with proper pattern measurements invalidate a pattern and can lead traders astray. The Gartley, butterfly, bat and crab are the better-known patterns that traders can watch for. Entries are made in the potential reversal zone when price confirmation indicates a reversal, and stops are placed outside the nearest significant (for the pattern) Fibonacci level that was not hit by the BC or XA extensions/retracements into the D (PRZ) area.

Read more »

Top Fibonacci Retracement Mistakes To Avoid

Top Fibonacci Retracement Mistakes To Avoid 

Every trader will use Fibonacci retracements at some point in their trading career. Some will use it just some of the time, while others will apply it regularly. But no matter how often you use this tool, what's most important is that you use it correctly each and every time. (For background reading on Fibonacci, see Fibonacci And The Golden Ratio.)
Improperly applying technical analysis methods will lead to disastrous results, such as bad entry points and mounting losses on currency positions. Here we'll examine how not to apply Fibonacci retracements to the foreign exchange markets. Get to know these common mistakes and chances are you'll be able to avoid making them - and suffering the consequences - in your trading.

1. Don't mix Fibonacci reference points.

When fitting Fibonacci retracements to price action, it's always good to keep your reference points consistent. So, if you are referencing the lowest price of a trend through the close of a session or the body of the candle, the best high price should be available within the body of a candle at the top of a trend: candle body to candle body; wick to wick.
Misanalysis and mistakes are created once the reference points are mixed - going from a candle wick to the body of a candle. Let's take a look at an example in the euro/Canadian dollar currency pair. Figure 1 shows consistency. Fibonacci retracements are applied on a wick-to-wick basis, from a high of 1.3777 to the low of 1.3344. This creates a clear-cut resistance level at 1.3511, which is tested and then broken.  

Figure 1: A Fibonacci retracement applied to price action in the euro/Canadian dollar currency pair.
Figure 2, on the other hand, shows inconsistency. Fibonacci retracements are applied from the high close of 1.3742 (35 pips below the wick high). This causes the resistance level to cut through several candles (between February 3 and February 7), which is not a great reference level.

Figure 2: A Fibonacci retracement applied incorrectly.
By keeping it consistent, support and resistance levels will become more apparent to the naked eye, speeding up analysis and leading to quicker trades.  

2. Don't ignore long-term trends.

New traders often try to measure significant moves and pullbacks in the short term - without keeping the bigger picture in mind. This narrow perspective makes short-term trades more than a bit misguided. By keeping tabs on the long-term trend, the trader is able to apply Fibonacci retracements in the correct direction of momentum and set themselves up for great opportunities.

In Figure 3, below, we establish that the long-term trend in the British pound/New Zealand dollar currency pair is upward. We apply Fibonacci to see that our first level of support is at 2.1015, or the 38.2% Fibonacci level from 2.0648 to 2.1235. This is a perfect spot to go long in the currency pair.  

Figure 3: A Fibonacci retracement applied to the British pound/New Zealand dollar currency pair establishes a long-term trend.
 But, if we take a look at the short term, the picture looks much different.

Figure 4: A Fibonacci retracement applied on a short-term time frame can give the trader a false impression.
After a run-up in the currency pair, we can see a potential short opportunity in the five-minute time frame (Figure 4). This is the trap.

By not keeping to the longer term view, the short seller applies Fibonacci from the 2.1215 spike high to the 2.1024 spike low (February 11), leading to a short position at 2.1097, or the 38% Fibonacci level.

This short trade does net the trader a handsome 50-pip profit, but it comes at the expense of the 400-pip advance that follows. The better plan would have been to enter a long position in the GBP/NZD pair at the short-term support of 2.1050.
Keeping in mind the bigger picture will not only help you pick your trade opportunities, but will also prevent the trade from fighting the trend.

3. Don't rely on Fibonacci alone.

Fibonacci can provide reliable trade setups, but not without confirmation.

Applying additional technical tools like MACD or stochastic oscillators will support the trade opportunity and increase the likelihood of a good trade. Without these methods to act as confirmation, a trader will be left with little more than hope of a positive outcome.

Taking a look at Figure 5, we see a retracement off of a medium-term move higher in the euro/Japanese yen currency pair. Beginning on January 10, 2011, the EUR/JPY exchange rate rose to a high of 113.94 over the course of almost two weeks. Applying our Fibonacci retracement sequence, we arrive at a 38.2% retracement level of 111.42 (from the 113.94 top). Following the retracement lower, we notice that the stochastic oscillator is also confirming the momentum lower. 

Figure 5: The stochastic oscillator confirms a trend in the EUR/JPY pair.
Now the opportunity comes alive as the price action tests our Fibonacci retracement level at 111.40 on January 30. Seeing this as an opportunity to go long, we confirm the price point with stochastic - which shows an oversold signal. A trader taking this position would have profited by almost 1.4%, or 160 pips, as the price bounced off the 111.40 and traded as high as 113 over the next couple of days.

4. Don't use Fibonacci over short intervals.

Day trading the foreign exchange market is exciting but there is a lot of volatility.

For this reason, applying Fibonacci retracements over a short time frame is ineffective. The shorter the time frame, the less reliable the retracements levels. Volatility can, and will, skew support and resistance levels, making it very difficult for the trader to really pick and choose what levels can be traded. Not to mention the fact that in the short term, spikes and whipsaws are very common. These dynamics can make it especially difficult to place stops or take profit points as retracements can create narrow and tight confluences. Just check out the Canadian dollar/Japanese yen example below.

Figure 6: Fibonacci is applied to an intraday move in the CAD/JPY pair over a three-minute time frame.
In Figure 6, we attempt to apply Fibonacci to an intraday move in the CAD/JPY exchange rate chart (over a three-minute time frame). Here, volatility is high. This causes longer wicks in the price action, creating the potential for misanalysis of certain support levels. It also doesn't help that our Fibonacci levels are separated by a mere six pips on average - increasing the likelihood of being stopped out.

Remember, as with any other statistical study, the more data that is used, the stronger the analysis. Sticking to longer time frames when applying Fibonacci sequences can improve the reliability of each price level.

The Bottom Line

As with any specialty, it takes time and practice to become better at using Fibonacci retracements in forex trading. Don't allow yourself to become frustrated; the long-term rewards definitely outweigh the costs. Follow the simple rules of applying Fibonacci retracements and learn from these common mistakes to help you analyze profitable opportunities in the currency markets.  
Read more »

Risk-Reward Ratio in Trading

http://nse-bse-mcx-technicalanalysis.blogspot.in/

Risk-Reward Ratio in Trading

It is very easy to find hundreds of articles about risk/reward ratio in trading, but the problem is that most of those articles are not written by real traders who trade for a living or have been working as professional traders for a while. Most of them are written by freelance writers who are paid to write articles or bloggers and webmasters who want to drive some traffic to their weblogs and websites.
Most of these writers have never placed any order on the market throughout their lives. The bigger problem is that novice traders believe each and every word of these articles, just because they are published on the internet, but they don’t know that the directions that these articles give are not applicable in live trading. After reading these articles, novice traders try to apply them in their trades and after such a long time of trial and error, they will think that they are not able to follow the trading rules and so they give up, whereas it is the information and directions of the articles that can not be applied in live trading.
For example, on most of the articles you read about risk/reward ratio, it is strongly recommended that novice traders should not even think about taking positions with a risk/ratio of as high as 1:1 or even 1:2 (I will explain what these numbers mean later in this article) and the maximum risk/reward ratio of the positions that new traders take should be 1:3. There is nothing wrong with it so far, but the problem is that these articles never clarify if traders should have a low risk/reward ratio through having wide targets OR tight stop losses. As nobody likes to lose, specially new traders, they all think that they should make their stop loss as tight as possible to have a low risk/reward ratio trade, whereas this is a big mistake. No matter how tight or wide the targets are, a trader can not fool around with the stop loss. Choosing the stop loss has its own rules that can not be ignored or broken. If you set your stop loss tighter than what it has to be, you will be stopped out easily even when your position is correct.
Something that looks even stranger in these articles is that they emphasize that “novice” traders should not take positions with 1:1 or 1:2 risk/reward ratios. Does it mean that experienced traders can do it? Are there different trading rules and techniques for novice and experienced traders? Maximizing the profit and having 1:3 or 1:5 trades can be done by professional and experienced traders, but there are some technical and emotional difficulties in front of novice traders to do that. For example, to achieve a successful 1:5 trade, you may have several losing trades (I will tell you why). This is not a problem for professional traders at all, but for a novice trader who is learning the techniques and has to build his/her confidence at the same time, having losing trades can cause lack of confidence and excessive fear that prevent him/her from advancing to the next steps.
So we can not believe and apply whatever we read over the internet. There are zillions of systems, techniques, indicators, robots and… that are absolutely useless when it comes to live and real trading.
After the above introduction, lets see what risk/reward ratio is and why it is important in forex trading. Risk is the amount of the money that you may lose in a trade. If you have already read the money management article, you know that we should not risk more than 2-3% of our capital in each trade. It means when we find a trade setup and we find a proper place for the stop loss, we have to choose our position lot size in the way that if the market hits our stop loss, we lose maximum 2-3% of our capital. For example we have found a trade setup with EUR-USD that has to have an 80 pips stop loss. We have a $5000 account. If EUR-USD hits our stop loss, we should lose $150 which is 3% of our capital (0.03 x $5000 = $150). It means 80 pips equals $150 (you can use the position size calculator I have on the money management article). This $150 is our risk. But what is the reward? Reward is the profit that we can make in a trade. In the above example, if we choose a 160 pips target for our trade and EUR-USD hits this target, we will make $300 (when 80 pips equals $150, so 160 pips equals $300). This $300 profit is the reward.
So what is the risk/reward ratio of this trade? 150:300 = 1:2
The larger the profit (target) against the loss (stop loss), the smaller the risk/reward ratio which means your risk is smaller than your reward. For example if your stop loss is 20 pips in a trade and your target is 100 pips, your risk/reward ratio will be 1:5 in this trade.
What is the recommended risk/reward ratio in  trading?
1:3 or 1:5 risk/reward ratio is achievable when the market forms a trend and you succeed to enter on time. In most cases you should be able to hit the top and bottom of the trends, no matter on what time frame you trade. Or if you enter at the middle of the way, the trend should be strong enough to give you another big movement and make a profit which is 3 or 5 times bigger than your stop loss. You can do that. Why not? But there are just a few problems: 1. Markets form a trend in less than 30% of the cases; 2. Some trends are not strong enough that if you enter with delay and while they are at the middle of the way, they can hit your target which is 3 or 5 times bigger than your stop loss. 3. There are many cases that you miss the trends; you hesitate to enter and so you miss the chance; you think you have found a trend whereas you are wrong and it returns and hits your stop loss and… . So you lose in many trades, because you want to catch a big one.
So in reality, you have to lose in many trades, or have many of your trades closed at breakeven by the stop loss (because you will have to move the stop loss to breakeven when you are in a special amount of profit), or not to trade for such a long time waiting for a strong trend, until you can have a 1:3 or 1:5 trade.
How is it possible to catch a 1:3 or 1:5 trade without losing so many other trades?
If you take a position with 1:3 or 1:5 stop loss to target ratio and then you wait for it to hit your stop loss or target, you will have so many losing trades before having a winning trade. The reasons are mentioned above.
The solution is in moving the stop loss. You should not let your stop loss remain at its initial position. To have a 1:3 trade, the distance of your entry and your final target should be splitted into 3 parts (at least), while each part is equal to your original stop loss value. For example if you have a 50 pips stop loss, you should have a final target for 150 pips which should be splitted into three 50 pips levels. Then you should move your stop loss in three stages (in this example I assume that you take a 3% risk in each trade):
1. If the price reaches to the first 1/3 level, you should move the stop loss to breakeven. At this stage, if the price goes against you and hits the stop loss, you will get out without any profit/loss, BUT you should consider that you had an initial risk of 3%.
2. If it reaches the 2/3 level, you should move the stop loss to 1/3 level. At this stage, if the price goes against you and hits the stop loss, you will get out with a profit which equals your initial risk. For example if your stop loss has been 3% of your account, you will get out with a 3% profit. Therefore, such a trade will be ended as a 1:1 risk/reward trade.
3. If it becomes so close to the final target, you should move the stop loss to 2/3 level. Then you have to wait until it hits the final target or returns and hits the stop loss. At this stage, if it goes against you and hits the stop loss, you will get out with a profit which is twice of your initial risk. For example if your stop loss is 3% of your account, you will get out with a 6% profit. Therefore, such a trade will be ended as a 1:2 risk/reward trade. If the price hits the final target, your trade will be closed with a 9% profit and so you will have a 1:3 risk/reward trade.
So, to have a 1:3 trade, you will have some -3% trades which are those trades that hit the stop loss at its initial position. You will also have some 0% trades that are those trades that hit the stop loss at breakeven. Some of your trades will be +3% trades which are those that hit the stop loss at 1/3 level. Some will be +6% trades which are those that hit the stop loss at 2/3 level. And finally, some trades will be +9% trades which are those that trigger the final target.
Now the question is what percent of your trades will be -3%, 0%, +3%, +6% and 9% trades?
It is impossible to answer the above question, because it depends on many things including the trading strategy and market condition. However, there is something that gives us a clue about the number of our 1:3 and 1:5 trades. It is the fact that says market trends only in 30% of the cases and it makes ranging, 70% of the time. To have 1:3 and 1:5 trades, we should have a strong trend, otherwise our stop loss will be triggered in one of the stages before reaching the final target, no matter what time frame you use to take your position.
No need to remind again that in any of the -3%, 0%, +3%, +6% and 9% trades your risk is the same which is 3%. The first conclusion is that taking the risk and the position is up to you, BUT it is the market that determines how your trade should be ended. This is something that all traders, specially novice ones should consider. When you read in different websites and web pages that your trades should only be 1:3 and 1:5 trades, you should consider that you really never know how many of your trades will be ended as 1:3 and 1:5 trades.
The stop loss of the positions that I take are chosen based on the technical analysis rules that I have for myself. I will never break any of these rules. Some traders think that my stop losses are too wide, but they are not. Unlike some other traders who have a constant value for their stop loss (for example any position they take, with any currency pair and any time frame, has a 120 pips stop loss), I mainly follow the rule of thumb we have for setting the stop loss. The rule says that you should place your stop loss in a position that becomes triggered only when the direction you choose is completely wrong. So when I want to set the stop loss, I ask myself under what condition the position I have taken is wrong. The answer I give to this question is the position of the stop loss. In one of the articles I published long time ago, I have explained about setting the stop loss and target orders.
So my stop losses can not be tighter. What about the targets? Can they be wider?
In the way that I choose the entries, most of our trades can have bigger targets and having 1:2 and 1:3 trades is possible with most of the positions we take, because our entry point is always well-chosen. Of course it can be different in different days, weeks and months. I will tell you how to trade my signals in the way that you can have 1:3 trades.
Now the question is if my signals can be used to have 1:3 and even 1:5 positions, why my targets are smaller than what they can be?
As you know in the typical signals that I send the members, usually there are two targets. The first target is usually half of the stop loss size and the second target is the same size as the stop loss. Traders can close 50% of their positions at the first target and then move the stop loss to breakeven. Then they can close the second 50% at the second target. There is a second way too. They can just move the stop loss to breakeven when the price reaches the first target and then close the whole position at the second target. In the last performance report I have published, I have explained 4 different ways that members can trade the signals I send them.
To answer the above question that why my targets are small, I have to say that they are small because there are different traders with different levels of skill among the members. Advanced traders know how to maximize their positions. They just use my signals to enter. However there are many other members who like to take as many positions as they can and they like to see them finished all green and positive. As I said above, they are building their confidence while they are learning the techniques. They need to see the positive result of the things they are learning. They are not disciplined and patient enough yet to maximize their trades and it is so painful to them, if a position which is in a good profit, suddenly goes against them and hits the stop loss at breakeven and they get out without any profit. The tight targets I have in the signals I send the members, are for these members. Unlike the others who believe novice traders should start with 1:3 and 1:5 trades, I believe they should start with 1:1 and even bigger risk/reward ratios to build their confidence. When they become more skilled, which can take them a few years at least, they can maximize their profits and have 1:3 and 1:5 positions. I am 100% sure that those who say novice traders should only take 1:3 and 1:5 positions, are not real traders and know nothing about live and even demo trading. Unfortunately there are zillions of them these days who develop  websites, weblogs and even robots and e-books. Forex is just a market for them to make money, not through  trading, but through selling useless  related products to “novice” traders.
Anyway!
From now on, each signal comes with two sets of targets. In the first set, the targets will be the same as they were used to be in the signals I sent. In the second set, the targets will be for a 1:3 risk/reward trade. The stop loss will be the same in both sets, because as I said I can not make the stop losses tighter. It is up to the members to choose the way they like to trade. We will have enough instructions in members area to help members to take their positions with any level of risk/reward ratio they like.
Read more »

Gann Theory - Gann analysis

Gann Theory

 Investment strategy developed by W D Gann, a successful twentieth century Wall Street trader, using continuous detailed analysis of the rate of change of stockmarket prices and applying strict trading rules, especially stop-loss levels.  The Gann analysis is based on Natural Law, geometrical proportions, and the Gann’s law of vibration, where every asset has its own vibration according to its individual energy.

Gann analysis

William Delbert Gann, was the creator of the  very popular Gann analysis, which includes such tools as  the Gann Fan, Gann Trend and Gann Grid. Gann used Natural Law (the usage of reason to analyse human nature and its moral acts) and geometric proportions based on the circle, square and triangle, to forecast prices and to provide a base for his theories. His analyses were based only on the relationship between time and price. 
Another theory  which the general Gann analysis is based on is the Law of Vibration. The principles of  Gann’s Law of Vibration, applied to the capital markets, were first presented to the public in his interview in 1909 to the “Ticker and investment digest”, and may be summarised as follows:

Each stock has its own distinctive path and range of activities based on trade volume, direction and others. All of them  move according to their individual patterns or as defined by Gann “Vibrations”. Gann also compared the stocks to atoms by stating that the first are also a kind of centre of energy which may also be defined mathematically. Another interesting statement from Gann is the opinion that stocks possess powers just as magnets do - they can attract and repel - meaning that sometimes they may be leaders in a market for a moment, and in the next, just stagnate.
 
Together with the above theories, Gann concepts were mostly based on mathematics, and its numbers retrieved from ancient history, like egyptology or even the bible. Some numbers had special meaning in his concepts of price forecasting, the most significant being 16, 25, 36, 49, 64, 121 and 144. According to Gann, these numbers together with geometry and  natural law have provided the proposed tools with a very significant forecasting ability.

Rule of thumb

  • Gann's theoretical approach may seem to be rather enigmatic, however its practical application on financial markets comes down to usage of a number of tools
  • The  most important are described within this section, and it can be quite simple
Gann Line

Gann Line is a simple tool indicating the direction of a current market tendency and its possible points of reversal.
The Gann Line is the most basic tool among the array of forecasting instruments based upon the theory created by W.D. Gann. The method is constituted by a line, drawn at an angle of 45 degrees, either ascending or descending. According to Gann’s theory, the trendline at 45 degrees represents a long-term trendline.


In the case of an ascending line, as long as prices remain above the trendline, the market is considered to be bullish. A fall of a price below that level may indicate a discontinuation of  a rising trend. On the other hand, prices below the descending line signal a significant downward market trend.

Rule of thumb

  • The Gann Line is based on the theory that the long-term trends follow a 45 degree line
  • As long as the prices remain above this line, the market tendency is considered to be bullish
Gann Grid
 
The Gann Grid may appear to be chaotic at first glance, however once properly set, it may provide insight into the development of the situation on the market.

Gan Grid is a variation of the 45 degrees Gann’s Line.

The 45 degree trendline is considered a long term trend, and prices  above that line are considered to be bullish. A situation when the market prices remain under the 45 degree line is considered to be bearish. Instead of having only one 45 degree trendline, the grid compiles a set of 45 degree lines plotted over a price chart. Whenever the price stays above one of the ascending lines, the asset is considered to be in a bullish movement.


On the other hand, whenever the price stays below one of the descending lines, the asset is considered to be in a bearish movement.

Rule of thumb

  • Gann Grids implement the Gann’s theory, where a grid of lines at 45 degrees indicates  possible market patterns.
Gann Fan
 
Gann Fan is based on the theory that the relationship between time and prices follows certain patterns, and the tool is aimed at the separation of bullish from bearish prices.

The Gann Fan is one of the many techniques W.D. Gann developed to study price movements.
For the Gann Fan, it is required for charts to be drawn with equal time and price intervals, so that a price movement for each time interval equals a 45 degree angle. Gann believed that the ideal balance between time and price exists when prices move at a 45 degree angle, relative to the time axis.

Based on Gann theories, the Gann Fan is made up of 9 trendlines, which function as  support and resistance lines. When a price breaks one line, it should move to another line. The most important line in the Gann Fan is the 1x1 trendline (based on the 45 degree Gann line). Depending on the price being above or below this line, it will indicate a bull  or bear market. Besides this major trendline, Gann indicates 8 other minor trendlines, with angles greater/less than 45 degrees (4 greater and 4 less than 45 degrees). These minor trendlines are 1x2, 1x3, 1x4, and 1x8.

Rule of thumb

  • The Gann Fan is generally used to determine trends - general market directions and potential support and resistance lines.
Read more »

Mistakes of stock Investment.

 5 mistakes of my first stock Investment

Do you remember your first stock market trade and how you behaved at the time? Just like you, even I, have made some really stupid mistakes while investing. Today, I would like to share some mistakes (only the big ones :)) which I made during my first trade in stock markets. Its worth discussing, how I could have avoided those mistakes. You can learn from them too!

Mistake 1 : Buying on Others Recommendation.

27th Nov 2007 : I had just got my spanking new trading account and I was so eager to trade and make lots of money(How to start in Stock Market) . I saw an Orkut community recommending GTC India – a “Buy” Recommendation. There were several good reasons discussed there, and an extrapolation on how it can reach from current price of 600 to 2000 in some months.  It looked like a “don’t-miss” trade. I bought 10 shares @ 560/-.
Mistake : Buying only on recommendation and not analysing the opportunity well, over relying on others recommendation, buying a company which I do not understand enough .
Learning : Never buy, just on recommendation! Do your own study and analysis. When you buy on others recommendation, you don’t take responsibility if there is any loss, which is dangerous in markets. Hear others but listen to your self. See other factors like market trends, sector view, global markets, future prospects et al. Once you are fully confident that its a good trade and you feel comfortable with it… go for it.

Mistake 2 : Being too greedy

After 3 days : Just after I bought the shares, it went up from 560 to 800 in 3-4 days. I thought that its moving as expected, and bought 10 more shares at 800. Within another week, it went up more to 950! Now, I was flying! I bought 10 more shares @955 again, to reach the target of 1500+ . My average buy price was now 772 . I was feeling little bad for not buying 30 shares directly @560 in the start .
Mistake : Greed! Pure & simple… This is a very common mistake, a big mistake at that – so big that it will be among the top mistakes investor and traders do. Buying more wasn’t wrong. It was the intention behind the buy. There is nothing wrong in increasing the position once it moves to your target, but it has to be backed up with strong reasons and study. It should be a trade with high probability of success. In my case, it was not. It was just a recommendation from someone in an orkut community, with a couple of lines, explaining, why it will go up .
Learning : There was no need to buy more shares that point in time. I should have just sat back and watched. The Stock market is just like our life, you need to have a level of satisfaction in your life and stock markets. If you want more and more and more, you might not get anything. In fact, you can lose heavily. Because of greed, I invested more than I could afford to lose. I took an unwanted and unaffordable risk, because I only saw profits and never the potential losses.

Mistake 3 : No profit booking on Time

After 1 week : The prices were not moving now. It was going up a bit then coming down again and was stuck in a range of 900-1000. It went up to 990 once. For a time being there was doubt in my mind if it will not move up to 2000 and will return back to my buy price levels.
Mistake : No profit booking. There was a sharp rise in shares price from 550 to 900 in just 2-3 weeks and that is rare. It doesn’t happen to every stock, it was an excellent return, but i did not book profits. Instead of making the best of the situation and taking the (not so bad) profits, the market was offering me,  I wanted more and more and lost even what I was getting.  The reason was Greed, again.
Learning : The better thing to have done, was to book profits, at least partially… Situations change in markets, I never checked on any news regarding the company after i bought the shares, and I was never updated about it. Every time you get some good profit, its a wise idea to at least book some partial profits out of it (Unless you have really strong reasons to hold it for long) .

Mistake 4 : Having Ego

In next 1 week : Prices now started coming down. It came to 900 first, I was scared and told myself that I will book profits once it goes back to levels of 950+. It never did! Then it came back to 800 and I regretted not booking a profit at 900 and said to myself again “I will book it for sure when it comes to 850.” Guess what? It never did! Then it went up a bit again and went up to 850 . I forgot my promise to myself & allowed my greed to take over my promise. It went down again after that and now it was near my average buy price. This was the time I was feeling, “What a big fool am I, for not booking Great profits!” I could have sold it at 0% profit, & yet I didn’t, because I would look a fool in my own eyes. Why Stock Markets Attract and Look Easy
Mistake : Ego ! Fear of losing part of profits, another mistake was the fear of not making any profits and fear of losing some money . Fear! Fear! Fear!
Learning : “When your boat starts sinking, you don’t pray… just jump” Once you are doubtful, surrender to markets wish. See what markets are showing you, not what you wanted to see. Markets are supreme and no one can be smarter than the markets. Leave your ego at your home, when you go in front of Markets. The markets tell you what’s going to happen, not vice versa. Accept that you are wrong and you made a mistake. Then move on.

Mistake 5 : No Patience

After few days : Then the prices started falling and plummeted to 600 (my original buy price). Now I was in loss. I was proven wrong, but I just couldn’t accept it. I kept trying to prove myself right by holding it and hoping it would come back up. Yea, you know… It never did . It went lower and lower and lower and I was just praying &  hoping that it’d return back to a level where I’d be happy to sell it. It never did! It went up to 300 and I sold it all in frustration. Then, I saw it go down to 250 and bounce back to 500! Now, I was feeling like I was cheated by the market for not giving me the right opportunity to exit.
Mistake : Impatience, Fear  and not cutting my losses short. I exited at a very bad time, at almost the lowest price then. There was an opportunity for me to exit at small loss, but taking a loss hurts the ego and it did. Not cutting my loss in time was the result, of my not defining my loss early enough. I should have had thought of it earlier. Then, I’d just pull a trigger, when it reached that level, without emotions. Fear overtook common sense, Fear overtook logic .
Learning : I should have defined my Target and Losses before taking the trade. I should have been realistic and logical. I should have waited little more time and then exited at a better price. I should have consulted someone, better than me (At that time though, even a street dog could have given a better advice than me :))
Price of GTC INDIA after this Incident : It never went above price levels after that and went to Rs 55 after couple of months , even  (Nov , 2010) , its hovering below Rs 65 only .

Conclusion and Summary

My first trade was not at all planned and “no plan” is “a plan to fail” . Fear! Greed! Emotion! Ego! Impatience! . These are the elements of Failure in Stock markets. Manage them well and you’ll do better!
Read more »
 
SORRY ADBLOCKER DETECTED
It looks like you're using an ad blocker. That's okay. Who doesn't?
But without advertising-income, we can't keep making this site awesome.
Please disable your ad blocker and then reload the page to continue enjoying our site.
Reload Page
Beyond The Technical Analysis - Contact