


![[Valid Atom 1.0]](https://lh3.googleusercontent.com/blogger_img_proxy/AEn0k_vwQh4bBjI8U_3c4yeq2fB5ykuWOV5npGVgFauGBaPih28JWN9pin1eQEO0gVBZzKVdGLFHHDuBSUrcLJmQKXzVcfqBes15LDMHRGovHF1m5rk=s0-d "Validate my Atom 1.0 feed")
PIVOT POINT
 Pivot Point is a technical indicators, pivot point is a method of calculating the support and resistance for a particular index/scrip for a particular time frame like daily, weekly or monthly basis. The pivot point changes at the end of every day for the next day depending on open, low, high & close values.
 There are mainly 5 types of Pivot Points:
1. Floor Pivot Points
2. Woodie's Pivot Points
3. Tom DeMark's Pivot Point
4. Camarilla Pivot Point
5. Fibonacci Pivot Point
Professional traders and market makers use pivot points to identify potential support and resistance levels. Simply put, a pivot point and its support/resistance levels are areas at which the direction of price movement can possibly change. The reason why pivot points are so enticing? It's because they are OBJECTIVE. Unlike some of the other indicators that we've taught you about already, there's no discretion involved. In many ways, pivot points are very similar to Fibonacci levels. Because so many people are looking at those levels, they almost become self-fulfilling. The major difference between the two is that with Fibonacci, there is still some subjectivity involved in picking Swing Highs and Swing Lows. With pivot points, traders typically use the same method for calculating them. Many traders keep an eye on these levels and you should too. Pivot points are especially useful to short-term traders who are looking to take advantage of small price movements. Just like normal support and resistance levels, traders can choose to trade the bounce or the break of these levels.
Range-bound traders use pivot points to identify reversal points. They see pivot points as areas where they can place their buy or sell orders.
Breakout traders use pivot points to recognize key levels that need to be broken for a move to be classified as a real deal breakout.
Here is an example of pivot points plotted on a 1-hour EUR/USD chart:

As you can see here, horizontal support and resistance levels are placed on your chart. And look - they're marked out nicely for you! How convenient is that?! Here's quick rundown on what those acronyms mean:
PP stands for Pivot Point.
S stands for Support.
R stands for Resistance.
But don't get too caught up in thinking "S1 has to be support" or "R1 has to be resistance." We'll explain why later.
In the following lessons, you will learn how to calculate pivot points, the different types of pivot points and most importantly, how you can add pivot points to your trading toolbox!
How to Calculate Pivot Points
The first thing you're going to learn is how to calculate pivot point levels.
The pivot point and associated support and resistance levels are calculated by using the last trading session's open, high, low, and close. Since forex is a 24-hour market, most traders use the New York closing time of 4:00pm EST as the previous day's close.
The calculation for a pivot point is shown below:
Pivot point (PP) = (High + Low + Close) / 3
Support and resistance levels are then calculated off the pivot point like so:
First level support and resistance:
First resistance (R1) = (2 x PP) - LowFirst support (S1) = (2 x PP) - High
Second level of support and resistance:
Second resistance (R2) = PP + (High - Low)Second support (S2) = PP - (High - Low)
Third level of support and resistance:
Third resistance (R3) = High + 2(PP - Low)Third support (S3) = Low - 2(High - PP)
Keep in mind that some charting software plot intermediate levels or mid-point levels. These are basically mini levels between the main pivot point and support and resistance levels.

If you hated algebra, have no fear because you don't have to perform these calculations yourself. Most charting software’s will automatically do this for you. Just make sure you configure your settings so that it uses the correct closing time and price. Also we can use the calculator application. The calculator can come in handy, especially if you want to do a little back testing to see how pivot point levels have held up in the past. Remember, one of the advantages of using pivot points is that it is objective, so it's very easy to test how price reacted to them. Next up, we'll teach you the various ways in which you can incorporate pivot points into your trading strategy.
Range Trading with Pivot Points
The simplest way to use pivot point levels is to use them just like your regular support and resistance levels. Just like good ole support and resistance, price will test the levels repeatedly. The more times a currency pair touches a pivot level then reverses, the stronger the level is. Actually, "pivoting" simply means reaching a support or resistance level and then reversing. If you see that a pivot level is holding, this could give you some good trading opportunities. If price is nearing the upper resistance level, you could sell the pair and place a stop just above the resistance. If price was nearing a support level, you would buy and put your stop just below the level.
See? Just like you're regular support and resistance! Nothing hard about that!
Let's take a look at an example so you can visualize this. Here's a 15-minute chart of GBP/USD.

In the chart above, you see that price is testing the S1 support level. If you think it will hold, what you can do is buy at market and then put a stop loss order past the next support level. If you're conservative, you can set a wide stop just below S2. If price reaches past S2, chances are it won't be coming back up, as both S1 and S2 could become resistance levels. If you're a little more aggressive and confident that support at S1 would hold, you can set your stop just below S1. As for your take profit points, you could target PP or R1, which could also provide some sort of resistance. Let's see what happened if you bought at market.

And bam! Looks like S1 held as support! What's more, if you had targeted PP as your take profit point, you would have hit your PT! Woohoo! Ice cream and pizza for you! Of course, it ain't always that simple. You shouldn't rely only on the pivot point levels. You should note whether pivot point levels line up with former support and resistance levels. You can also incorporate candlestick analysis and other types of indicators to help give you more confirmation. For example, if you see that a doji has formed over S1, or that the stochastic is indicating oversold conditions, then the odds are higher that S1 will hold as support. Also, most of the time, trading normally takes place between the first support and resistance levels. Occasionally, price will test the second levels and every once in a while, the third levels will be tested. Lastly, you should also fully understand that sometimes, price will just break through all the levels like how Roger Federer breezes through the competition in Wimbledon. What will you do when that happens? Continue to hold onto your trade and be a sucker and watch your account dwindle away? Or will you take advantage and get back some pips? In the next lesson, we'll teach you how to take advantage when these levels break down.
Playing the Breaks with Pivot Points
Just like your normal support and resistance levels, pivot point levels won't hold forever. Using pivot points for range trading will work, but not all the time. In those times that these levels fail to hold, you should have some tools ready to take advantage of the situation! As we showed you earlier, there are two main ways to trade breakouts: the aggressive way or the safe way. Either method will work just fine. Just always remember that if you take the safe way, which means waiting for a retest of support or resistance, you may miss out on the initial move.
Let's take a look at a chart to see potential breakout trades using pivot points. Below is a 15-minute chart of EUR/USD.

Here we see EUR/USD made a strong rally throughout the day. We see that EUR/USD opened by gapping up above the pivot point. Price made a strong move up, before pausing slightly at R1. Eventually, resistance broke and the pair jumped up by price! If you had taken the aggressive method, you would have caught the initial move and been celebrating like you just won the Super Bowl. On the other hand, if you had taken the safe way and waited for a retest, you would have been one sad little trader. The price did not retest after breaking R1. In fact, the same thing happened for both R1 and R2! Notice how EUR/USD bulls tried to make a run for R3 as well. However, if you had taken the aggressive method, you would have gotten caught up in a fake out as the price failed to sustain the initial break. If your stop was too tight, then you would have gotten stopped out. Later on though, you'll see that the price eventually broke through. Notice how there was also a retest of the broken resistance line. Also, observe how when the pair reversed later in the day and broke down past R3. There was an opportunity to take a short on the retest of resistance-turned support - turned resistance (read that again if you have to!). Remember that, when support levels break, they usually turn into resistance levels. This concept of "role reversal" also applies for broken resistance levels which become support levels. These would have been good opportunities to take the "I think I'll play it safe" method.
Placing stops and targets with breakouts
One of the difficult things about taking breakout trades is picking a spot to place your stop. Unlike range trading where you are looking for breaks of pivot point support and resistance levels, you are looking for strong fast moves. Once a level breaks, in theory, that level will likely become "support-turned-resistance" or "resistance-turned-support." If you were going long and price broke R1, you could place your stop just below R1. Let's go back to that EUR/USD chart to see where you could place your stops.
As for setting targets, you would typically aim for the next pivot point support or resistance level as your take profit point. It's very rare that price will break past all the pivot point levels, unless a big economic event or surprise news comes out.
Let's go back to that EUR/USD chart to see where you would put those stops and take profit points.

In this example, once you saw price break R1, you would have set your stop just below R1. If you believed that price would continue to rise, you could keep your position and move your stop manually to see if move would continue. You'd have to watch carefully and adjust accordingly. You'll learn more about this in later lessons. As with any method or indicator, you have to be aware of the risks with taking breakout trades. First of all, you have no idea whether or not the move will continue. You might enter thinking that price will continue to rise, but instead you catch a top or bottom, which means that you've been faked out! Second, you won't be sure if it's a true breakout, or just wild moves caused by the release of important news. Spikes in volatility are a common occurrence during news events, so be sure to keep up with breaking news and be aware of what's on the market calendar for the day or week. Lastly, just like in range trading, it would be best to pop on other key support and resistance levels. You might be thinking that R1 is breaking, but you failed to notice a strong resistance level just past R1. Price may break past R1, test the resistance and just fall back down. You should make use of your knowledge of support and resistance, candlestick patterns, and momentum indicators to help you give stronger signals as to whether the break is for real or not.
Using Pivot Points to Determine Market Sentiment
There is one other way to incorporate pivot points into your trading strategy, and that's to use it to gauge market sentiment.What this means is that you can tell whether traders are more inclined to buy or sell the pair. All you would need to do is to keep an eye on the pivot point. You could treat it like the 50 yard line of a football field. Depending on which side the ball (in this case, price) is on, you can tell whether buyers or sellers have the upper hand. If the price breaks through the pivot point to the top, it's a sign that traders are bullish on the pair and you should start buying the pair like it's a Krispy Kreme donut. Here's an example of what happened when the price stayed above the pivot point.

In this example, we see that EUR/USD gapped up and opened above the pivot point. The price then rose higher and higher, breaking through all the resistance levels. Now, if price breaks through the pivot point to the bottom, then you should start selling the pair like it's Enron stock. The price being below the pivot point would signal bearish sentiment and that sellers could have the upper hand for the trading session.
Let's take a look at a chart of GBP/USD.

In the chart above, we see that the price tested the pivot point, which held as a resistance level. Next thing you know, the pair keeps going lower and lower. If you had taken the clue that price remained below the pivot point and sold the pair, you would have made some nice moolah. GBP/USD dropped almost 300 pips! Of course, it doesn't always work out like this. There are times when you think that traders are bearish on a pair, only to see that the pair reverses and breaks through to the top!
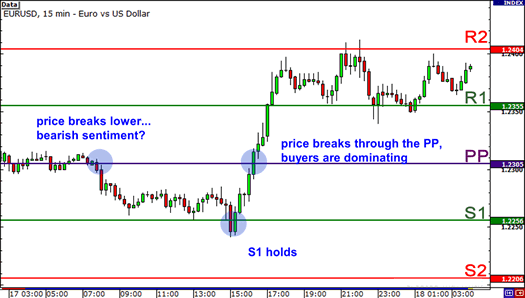
In this example, if you saw price breaking lower from the pivot point and sold, you would have had a sad, sad day. Later on during the European session, EUR/USD popped higher, eventually breaking through the pivot point. What's more, the pair stayed above the pivot point, showing how buyers were rockin' away. The lesson here? Traders are fickle! How traders feel about a currency can shift dramatically day to day, even session to session. This is why you cannot simply buy when price is above the pivot point or sell when it is below it. Instead, if you choose to use pivot point analysis in this way, you should combine it with other indicators to help you determine overall market sentiment.
Other Pivot Point Calculation Methods
While we suggest that you stick to the standard method of calculating pivot points, you should know that there are other ways to calculate for pivot points. In this lesson, we will talk about these other methods, as well as give you the formulas on how to calculate for these levels.Tom DeMark's pivot points
This are not pivot points exactly, but predicted low and high of the period. To calculate DeMark's pivot points follow these rules:
If Close < Open(current) Then X = H + 2 X L + C
If Close > Opencurrent Then X = 2 X H + L + C
If Close = Opencurrent Then X = H + L + 2 X C
New High = X / 2 - L; New Low = X / 2 - H
Woodie Pivot Point
R2 = PP + High - LowR1 = (2 X PP) - Low
PP = (H + L + 2C) / 4
S1 = (2 X PP) - High
S2 = PP - High + Low
C - Closing Price, H - High, L - Low
In the formulas above, you'll notice that the pivot point calculation is very different from the standard method.
Also, in order the calculate for the corresponding support and resistance levels, you would use the difference between the previous day's high and low, otherwise known as the range. Here's a chart example of the Woodie pivot point calculation applied on EURUSD. The Woodie pivot point, support levels, and resistance levels are the solid lines while the dotted lines represent the levels calculated through the standard method.

Because they have different formulas, levels obtained through the Woodie calculations are very different from those gotten through the standard method. Some traders prefer to use the Woodie formulas because they give more weight to the closing price of the previous period. Others prefer the standard formulas because many traders make use of those, which could make them self-fulfilling. In any case, since resistance turns into support (and vice versa), if you choose to use the Woodie formulas, you should keep an eye on these levels as they could become areas of interest. Whatever floats your boat!
Camarilla Pivot Point
R4 = C + ((H-L) x 1.5000)R3 = C + ((H-L) x 1.2500)
R2 = C + ((H-L) x 1.1666)
R1 = C + ((H-L) x 1.0833)
PP = (H + L + C) / 3
S1 = C - ((H-L) x 1.0833)
S2 = C - ((H-L) x 1.1666)
S3 = C - ((H-L) x 1.2500)
S4 = C - ((H-L) x 1.5000)C - Closing Price, H - High, L - Low
The Camarilla formulas are similar to the Woodie formula. They also use the previous day's close and range to calculate the support and resistance levels. The only difference is that you should calculate for 8 major levels (4 resistance and 4 support), and each of these levels should be multiplied by a multiplier. The main concept of Camarilla pivot points is that it is based on the idea that price has a natural tendency to revert back to the mean (sound familiar?), or in this case, the previous day's close. The idea is that you should buy or sell when price reaches either the third support or resistance level. However, if price were to burst through S4 or R4, it would mean that the intraday trend is strong, and it's about time you jump on that bandwagon! Check out how the Camarilla calculation gives different levels (solid lines) compared to the standard method's levels (dotted lines)!

As you can see from the chart above, more emphasis is given to the closing price as opposed to the pivot point. Because of this, it's possible that resistance levels could be below the pivot point or support levels could be above it.

See how all the support and resistance levels are above the Camarilla pivot point?
Fibonacci Pivot Point
R3 = PP + ((High - Low) x 1.000)
R2 = PP + ((High - Low) x .618)
R1 = PP + ((High - Low) x .382)
PP = (H + L + C) / 3
S1 = PP - ((High - Low) x .382)
S2 = PP - ((High - Low) x .618)
S3 = PP - ((High - Low) x 1.000)C - Closing Price, H - High, L - Low
R2 = PP + ((High - Low) x .618)
R1 = PP + ((High - Low) x .382)
PP = (H + L + C) / 3
S1 = PP - ((High - Low) x .382)
S2 = PP - ((High - Low) x .618)
S3 = PP - ((High - Low) x 1.000)C - Closing Price, H - High, L - Low
Fibonacci pivot point levels are determined by first calculating the pivot point like you would the standard method. Next, multiply the previous day's range with its corresponding Fibonacci level. Most traders use the 38.2%, 61.8% and 100% retracements in their calculations. Finally, add or subtract the figures you get to the pivot point and voila, you've got your Fibonacci pivot point levels!
Look at the chart below to see how the levels calculated through the Fibonacci method (solid lines) differ from those calculated through the standard method (dotted lines).

The logic behind this is that many traders like using the Fibonacci ratios. People use it for retracement levels, moving averages, etc. Why not use it for pivot points as well?
Remember that both Fibonacci and pivot points levels are used to find support and resistance. With so many traders looking at these levels, they can actually become self-fulfilling.
Which method is best?
The truth is, just like all the variations of all the other indicators that you've learned so far, there is no single best method. It really all depends on how you combine your knowledge of pivot points with all the other tools in your trading toolbox. Just know that most charting software that do automatic calculations normally use the standard method in calculating for the pivot point levels. But now that you know how to calculate for these levels on your own, you can give them all a swing and see which one works best for you. Pivot away!
Summary: Pivot Points

Here are some easy-to-memorize tips that will help you to make smart pivot point trading decisions:
- Pivot points are a technique used by traders to help determine potential support and resistance areas.
- There are four main ways to calculate for pivot points: Standard, Woodie, Camarilla, and Fibonacci.
- Pivots can be extremely useful in Stock Market since many share usually fluctuate between these levels. Most of the time, price ranges between R1 and S1.
- Pivot points can be used by range, breakout, and trend traders.
- Range-bound traders will enter a buy order near identified levels of support and a sell order when the pair nears resistance.
- Pivot points also allow breakout traders to identify key levels that need to be broken for a move to qualify as a strong momentum move.
- Sentiment (or trend) traders use pivot points to help determine the bullishness or bearishness of a currency pair.
- The simplicity of pivot points definitely makes them a useful tool to add to your trading toolbox. It allows you to see possible areas that are likely to cause price movement. You'll become more in sync to market movements and make better trading decisions.
- Using pivot point analysis alone is not always enough. Learn to use pivot points along with other technical analysis tools such as candlestick patterns, MACD crossover, moving averages crossovers, the stochastic, RSI, etc. The greater the confirmation, the greater your probability of a successful trade!

