


![[Valid Atom 1.0]](https://lh3.googleusercontent.com/blogger_img_proxy/AEn0k_ssRx3-L7U88HP6ZMASYqqEECPTjbY-UebtpOSyo5sahuqJItJR3qA0q3MeyeAQzLOibCctRW_BSpTREbUKhWJklPvw_08kzqCezsNyPk5jGgE=s0-d "Validate my Atom 1.0 feed")
Bullish Medium Reliability Reversal Candle Patters

1. BULLISH DRAGONFLY DOJI

Relevance: Bullish
Prior Trend: Bearish
Reliability: Medium
Definition:
The Bullish Dragonfly Doji Pattern is a single candlestick pattern that occurs at the bottom of a trend or during a downtrend. The Bullish Dragonfly Doji Pattern is very similar to the Bullish Hammer Pattern mentioned above. The distinction between the two is if there is a body or not. In case of Bullish Dragonfly Doji Pattern, the opening and closing prices are identical and there is no body. On the other hand the Bullish Hammer Pattern has a small real body at the upper end of the trading range.
Recognition Criteria:
1. There is an overall downtrend in the market.
2. Then we see a Doji at the upper end of the trading range.
3. The doji has an extremely long lower shadow.
4. However the doji does not have any upper shadow.
2. Then we see a Doji at the upper end of the trading range.
3. The doji has an extremely long lower shadow.
4. However the doji does not have any upper shadow.
Explanation:
The market is in an overall bearish mood characterized by a downtrend. Then market opens and sells off sharply. However, the sell-off is suddenly abated and the prices reverse direction and start going up for the rest of the day closing at or near the day’s high thus leading to the long lower shadow. The failure of the market to continue in the selling side reduces the bearish sentiment. Now the shorts are increasingly uneasy with their bearish positions. If the market opens higher next day, many shorts will have a strong incentive to cover their short positions.
Important Factors:
The Bullish Dragonfly Doji Pattern is a more bullish signal than a Bullish Hammer Pattern. Its reliability is also higher than the Bullish Hammer Pattern.
However, a confirmation of the trend reversal implied by this pattern by either a white candlestick, a large gap up or a higher close on the next trading day is still suggested, to be on the safe side.

2. Bullish Long Legged Doji Pattern

Type: Reversal
Relevance: Bullish
Prior Trend: Bearish
Reliability: Medium
Definition:
Long Legged Doji is a doji characterized with very long shadows. It shows the indecision of the buyers and sellers. It is one of the important reversal signals.
Recognition Criteria:
1. Market is characterized by a bearish mood and downtrend.
2. Then we see a Doji that gaps in the direction of the downtrend.
3. The real body is either a horizontal line or it is significantly small.
4. Both of the upper and lower shadows are long and they are almost equal in length.
2. Then we see a Doji that gaps in the direction of the downtrend.
3. The real body is either a horizontal line or it is significantly small.
4. Both of the upper and lower shadows are long and they are almost equal in length.
Explanation:
Long Legged Doji shows that there is a great deal of confusion and indecision in the market. This particular pattern shows that the prices moved well above and below the day's opening level, however they finally closed virtually at the same level with the opening price. The end result is only a little change from the opening price despite the whole volatility and excitement during the day that clearly reflects that the market lost its sense of direction.
Important Factors:
Long Legged Doji is more important at tops.
Long Legged Doji is a single candlestick pattern. It requires confirmation in the form of a move opposite to the prior trade on the next trading day.

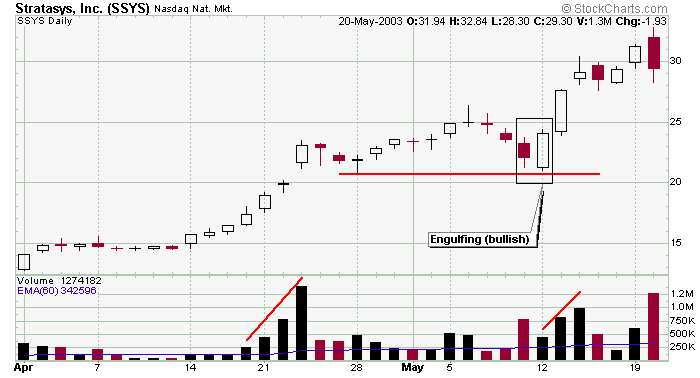
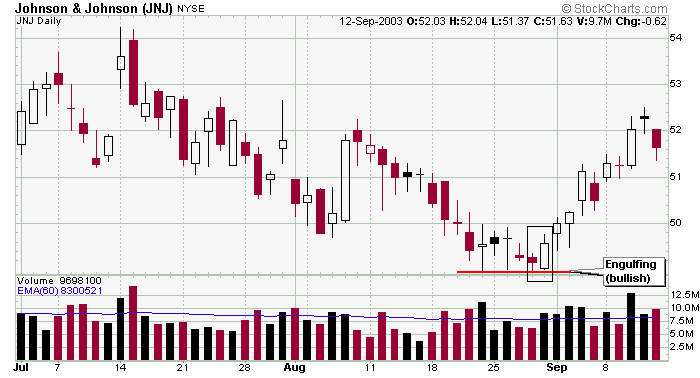
3. BULLISH ENGULFING
 Type: Reversal
Relevance: Bullish
Prior Trend: Bearish
Reliability: Medium
Confirmation: Suggested
Definition:
Bullish Engulfing Pattern is a pattern characterized by a large white real body engulfing a preceding small black real body, which appears during a downtrend. The white body does not necessarily engulf the shadows of the black body but totally engulfs the body itself. The Bullish Engulfing Pattern is an important bottom reversal signal.
Recognition Criteria:
1. Market is characterized by downtrend.
2. Then we see a small black body.
3. Next day we see a white body that completely engulfs the black real body of the preceding day.
Explanation:
While the market sentiment is bearish; we see some subsided selling reflected by the short, black real body of the first day. Next day shows bull strength with a closing price at or above the previous day’s open. It means that the downtrend is now losing momentum and the bulls started to take the lead.
Important Factors:
The relative size of the bodies in the first and second days is important. If the first day of the Bullish Engulfing Pattern is characterized by a very small real body (it may even be a doji or nearly a doji) but the second day is characterized by a very long real body, this strongly indicates that the bearish power is diminishing and the disparity of white versus black body is indicative of the emerging bull power.
There is higher probability of a bullish reversal if there is heavy volume on the second real body or if the second day of the Bullish Engulfing Pattern engulfs more than one real body (which essentially means we see two or more small black bodies preceding the long white body).
The reversal of downtrend needs further confirmation on the third day. This confirmation may be in the form of a white candlestick, a large gap up or a higher close on the third day.

4. BULLISH GRAVESTONE DOJI

Relevance: Bullish
Prior Trend: Bearish
Reliability: Medium
Confirmation: Suggested
Definition:
Gravestone Doji is a specific Doji with opening and closing prices equal to the low of the day. The Bullish Gravestone Doji Pattern is a bottom reversal pattern. Similar to its cousin the Bullish Inverted Hammer Pattern, it occurs in a downtrend and represents a possible reversal of trend.
Recognition Criteria:
1. Market is characterized by downtrend.
2. We see a black body formed at the lower end of the trading range.
3. We then see a Doji, which does not have a lower shadow in the second day.
4. No gap down is required.
2. We see a black body formed at the lower end of the trading range.
3. We then see a Doji, which does not have a lower shadow in the second day.
4. No gap down is required.
Explanation:
The market opens below the closing price of the previous day. Then there is a brief rally but the rally is not enough to send prices over the closing price of previous day and prices then reverse direction and fall down to the day’s lows. This movement however leaves shorts in a losing position creating the potential for an upcoming rally. It may not be clear why it signals a potential reversal. The answer has to do with what happens over the next session. If the next day opens above the real body of the Gravestone Doji, it means those who shorted at the opening (or closing) of the Gravestone day are losing money. The longer the market holds above Gravestone Doji’s real body the more likely these shorts will cover. The short will then spark a rally by covering their positions, which also encourage the bottom pickers to go long. The Gravestone Doji represents the graves of those bears that have died defending their territory.
Important Factors:
Bullish Gravestone Doji requires further confirmation on the next day. Confirmation may be in the form of the next day opening above the Gravestone Doji’s body. The larger the gap the stronger the confirmation will be. A white candlestick with higher prices can also be another form of confirmation.

5. BULLISH (DOJI) STAR
 Type: Reversal
Relevance: Bullish
Prior Trend: Bearish
Reliability: Medium
Confirmation: Suggested
No. of Sticks: 2
Definition:
Bullish (Doji) Star Pattern is a short candlestick, a spinning top, a high wave or a doji, which gaps from a long black candlestick during a downtrend.
Recognition Criteria:
1. Market is characterized by downtrend.
2. We see a long black candlestick on the first day.
3. Then we see a short candlestick, a spinning top, a high wave or a doji, that gaps in the direction of the previous trend on second day.
4. The shadows of this short candlestick, spinning top, high wave or doji are not long.
2. We see a long black candlestick on the first day.
3. Then we see a short candlestick, a spinning top, a high wave or a doji, that gaps in the direction of the previous trend on second day.
4. The shadows of this short candlestick, spinning top, high wave or doji are not long.
Explanation:
Usually a star that follows a long black candlestick in a downtrend indicates a change in the market environment. Bears were in control during the downtrend but now a change is implied by the appearance of a star that shows that the bulls and the bears are in equilibrium. The downward energy is dissipating. Things are not favorable for continuation of a bear market.
Important Factors:
A confirmation of the reversal on the third day is required. This confirmation of the trend reversal may be in the form of a white candlestick, a large gap up or a higher close on the next trading day (third day).
Note : The bullish Doji Star could be the first two days of the bullish Morning Doji Star or the bullish Abandoned Baby.


6. BULLISH HARAMI CROSS
 Type: Reversal
Relevance: Bullish
Prior Trend: Bearish
Reliability: Medium
Confirmation: Recommended
No. of Sticks: 2
Definition: Bullish Harami Cross Pattern is a doji preceded by a long black real body. The Bullish Harami Cross Pattern is a major bullish reversal pattern. It is more significant than a regular Bullish Harami Pattern.
Recognition Criteria:
1. Market is characterized by downtrend.
2. Then we see a long black candlestick.
3. Long black candlestick is followed by a doji completely engulfed by the real body of the first day. The shadows (high/low) of the doji may not be necessarily contained within the first black body, though it's preferable if they are.
Explanation:
The Bullish Harami Cross Pattern is a strong signal of disparity about the market’s health. During a downtrend, the heavy selling reflected by a long, black real body; is followed by a doji next day. This shows that the market is starting to severe itself from the prior downtrend.
Important Factors:
The Bullish Harami Pattern is not a major reversal pattern, however the Bullish Harami Cross Pattern is a major upside reversal pattern. Short traders will not be wise to ignore the significance of a harami cross just after a long black candlestick. Harami crosses point out to the bottoms.
A third day confirmation of the reversal is recommended (though not required) to judge that the downtrend has reversed. The confirmation may be in the form of a white candlestick, a large gap up or a higher close on the next trading day.

7. BULLISH HOMING PIGEON
 Type: Reversal
Relevance: Bullish
Prior Trend: Bearish
Reliability: Medium
Confirmation: Suggested
No. of Sticks: 2
Definition: Bullish Homing Pigeon Pattern is a small black real body contained by a prior relatively long black real body.
Recognition Criteria:
1. Market is in downtrend.
2. We see a black body in the first day.
3. Then we again see a black body in the second day where the real body of this second day is completely engulfed by the real body of the first day. It is not required that the shadows (high/low) of the second candlestick are contained within the first, though it's preferable if they are.
Explanation:
The Bullish Homing Pigeon Pattern is a signal of disparity. In a market characterized by downtrend, we first see heavy selling reflected by the long, black real body of the first day. However small body of second day points out to diminished power and enthusiasm of the sellers thus suggesting a trend reversal.
Important Factors:
The important fact about this pattern is the requirement that the second day has a minute real body relative to the prior candlestick and that this small body is completely contained by the larger one. The Bullish Homing Pigeon Pattern is not necessarily a signal for a rally. Market usually has a tendency to enter into a congestion phase following a Homing Pigeon.
We must check the third day to confirm that the downtrend has reversed. This confirmation may be in the form of a white candlestick, a large gap up or a higher close on the next trading day (on the third day).
NOTE: The bullish Homing Pigeon is similar to the bullish Harami and bullish Matching Low.

8. BULLISH MATCHING LOW
 Type: Reversal
Relevance: Bullish
Prior Trend: Bearish
Reliability: Medium
Confirmation: Suggested
No. of Sticks: 2
Definition:
Bullish Matching Low Pattern occurs when two black days appear with equal closes in a downtrend. The pattern is suggestive of a short-term support, and it may cause a reversal on the next day of trading.
Recognition Criteria:
1. The market moves in downtrend.
2. We then see a long black candlestick on the first day.
3. Second day follows with another black candlestick whose closing price is equal or extremely close to the closing price of the first day.
2. We then see a long black candlestick on the first day.
3. Second day follows with another black candlestick whose closing price is equal or extremely close to the closing price of the first day.
Explanation:
Market continues to move down as evidenced by first black candlestick. Next day; prices open at a higher level, they then continue to go up during the day but the day closes at a price which is equal to the closing price of the previous day. This pattern suggests a short-term support. Shorts should be aware of this fact. If they ignore Bullish Matching Low Pattern as a possible reversal signal, they may pay for it soon. Two days closing at the same price is indicative of short-term support and this support may be followed by a reversal on the next day of trading.
Important Factors:
The reversal of downtrend requires a confirmation on the third day. The confirmation of the trend reversal may be in the form of a white candlestick, a large gap up or a higher close on the next trading day (on the third day).
Note : The bullish Matching Low is similar to the bullish Homing Pigeon.


9. BULLISH MEETING LINES
 Type: Reversal
Relevance: Bullish
Prior Trend: Bearish
Reliability: Medium
Confirmation: Suggested
No. of Sticks: 2
Definition:
We sometimes see that market gaps sharply lower when it opens and then closes at the same level as the prior session’s close. This is seen following a black candlestick in a downtrend. Such an occurrence is called Bullish Meeting Lines Pattern that is a pattern reflecting a stalemate between bulls and bears.
Recognition Criteria:
1. Market is characterized by downtrend.
2. We see a black candlestick on the first day.
3. Then we see a long white candlestick on the second day. Its body is lower than the previous trend.
4. The closing prices are same or almost same on both days.
5. Both candlesticks are long but the second candlestick may be shorter than the first.
2. We see a black candlestick on the first day.
3. Then we see a long white candlestick on the second day. Its body is lower than the previous trend.
4. The closing prices are same or almost same on both days.
5. Both candlesticks are long but the second candlestick may be shorter than the first.
Explanation:
This pattern appears during a decline. The first candlestick of this pattern is long and black. However the next session opens sharply lower causing the bears to feel confident. Then the bulls start a counterattack pushing the prices up and leading to a close equal to previous close. The downtrend is now breached.
Important Factors:
The Bullish Meeting Lines Pattern is a pattern that is comparable to the Bullish Piercing Line Pattern. The Piercing Line has the same two-candlestick pattern. The main difference between the two is the fact that the bullish counterattack does not carry the prices up to the prior session’s white real body in the case of Bullish Meeting Lines Pattern. It can only get back to prior session’s close while The Piercing Line Pattern’s second line pushes well into the black real body. Consequently the Piercing Line Pattern is a more significant bottom reversal. Nonetheless, the Bullish Meeting Lines Pattern should also be respected.
The Bullish Meeting Lines Pattern requires confirmation of the reversal on the third day. This confirmation may be in the form of a white candlestick, a large gap up or a higher close on the third day.
NOTE: The bullish Meeting Lines is similar to the bullish Piercing Line, bearish In Neck, bearish On Neck, and bearish Thrusting.


10. BULLISH STICK SANDWICH
 Type: Reversal
Relevance: Bullish
Prior Trend: Bearish
Reliability: Medium
Confirmation: Suggested
No. of Sticks: 3
Definition:
The Bullish Stick Sandwich Pattern is characterized by consecutive higher opens for three days, but results in an eventual close equal to the first day's close. It may warn that prices are now finding a support price. We may then see a reversal from this support level.
Recognition Criteria:
1. Market is characterized by downtrend.
2. We see a Black Closing Marubozu in the first day.
3. Then we see a white candlestick, which is above the close of the first day.
4. Then we again see a Black Closing Marubozu characterized with a close equal to the close of the first day.
2. We see a Black Closing Marubozu in the first day.
3. Then we see a white candlestick, which is above the close of the first day.
4. Then we again see a Black Closing Marubozu characterized with a close equal to the close of the first day.
Explanation:
In the Bullish Stick Sandwich Pattern, there is a downtrend going on. Then prices open higher on the next trading day and they reach to higher levels all day, closing at or near the high. This bullish act suggests that the previous downtrend may now reverse implying that the shorts need protection. The next day, prices open at a higher level leading some shorts to cover their positions initially but then the prices start moving lower to close at the same price as two days ago. This pattern shows that the market is finding a support level and now the trend may reverse from this support level.
Important Factors:
A confirmation on the fourth day is required to be sure that the downtrend is reversed. Confirmation may be in the form of a white candlestick, a large gap up or a higher close on the fourth day.
11. BULLISH THREE STAR IN THE SOUTH
 Type: Reversal
Relevance: Bullish
Prior Trend: Bearish
Reliability: Medium
Confirmation: Suggested
No. of Sticks: 3
Definition:
We see three consecutive black candlesticks during a downtrend. These candlesticks show that each day is consecutively weaker in a bearish sense and possibly some buying is occurring. Daily small rallies keep the market’s lows from reaching that of the first day. These indications suggest that tide is turning in a bullish direction.
Recognition Criteria:
1. Market is characterized by downtrend.
2. We see a long Black Opening Marubozu in the first day characterized by a long lower shadow just like a Hammer.
3. Then we see a Black Opening Marubozu on the second day similar to the first day however smaller in body with a low above the first day’s low.
4. We finally see a small Black Marubozu on the third day that lies within the second day’s trading range.
Explanation:
The Bullish Three Stars in the South Pattern shows a slowly deteriorating downtrend, which is characterized by less and less daily price movement and consecutively higher lows. Buying enthusiasm is reflected by the long lower shadow of the first day. The next day opens at a higher level, trades lower, but its low is not lower than the previous day's low. This second day also closes off its low. Then we see a black Marubozu, which is engulfed by the previous day's range on the third day. Higher lows cause uneasiness among shorts. The last day of the pattern reflects market indecision, with hardly any price movement. Shorts are now ready to cover positions if they see anything in the upside. Everything points out that the tide is slowly turning toward the bull side.
Important Factors:
A confirmation on fourth day is required to be sure that the downtrend has reversed. This confirmation may be in the form of a white candlestick, a large gap up or a higher close on the fourth day.
Note: The bullish Three Stars in the South is similar to the bearish Three Black Crows.
12. BULLISH TRI STAR
 Type: Reversal
Relevance: Bullish
Prior Trend: Bearish
Reliability: Medium
Confirmation: Suggested
No. of Sticks: 3
Definition:
The Bullish Tri Star Pattern is a very rare but significant bottom reversal pattern. Three Dojis form this pattern. The middle Doji is a Doji Star.
Recognition Criteria:
1. Market is characterized by downtrend.
2. Then we see three consecutive Doji.
3. The second day Doji gaps below the first and third.
2. Then we see three consecutive Doji.
3. The second day Doji gaps below the first and third.
Explanation:
In the case of a Bullish Tri Star Pattern, we have a market, which is in a downtrend for a long time. However the weakening trend shows itself by the fact that the real bodies are probably becoming smaller. The first Doji is a matter of concern. The second Doji clearly indicates that market is losing its direction. Finally, the third Doji warns that the downtrend is over. This pattern indicates too much indecision leading to reversal of positions.
Important Factors:
A confirmation on fourth day is required to be sure that the downtrend has reversed. Confirmation may be in the form of a white candlestick, a large gap up or a higher close on the fourth day.
13. BULLISH UNIQUE THREE RIVER BOTTOM
 Type: Reversal
Relevance: Bullish
Prior Trend: Bearish
Reliability: Medium
Confirmation: Suggested
No. of Sticks: 3
Definition:
The Bullish Unique Three River Bottom Pattern is an extremely rare bottom reversal pattern. Its first candlestick is an extended black candlestick then followed by a second black real body closing higher than the first candlestick’s close, and the third candlestick is a white candlestick with a very small real body. The real white body shows that the market lost the selling pressure.
Recognition Criteria:
1. Market is characterized by a downtrend.
2. We see a long black candlestick in the first day.
3. Then we see a Hammer-like black candlestick on the second day.
4. The lower shadow of the second day sets a new low.
5. Then we see a short white candlestick, which is below the second day candlestick.
2. We see a long black candlestick in the first day.
3. Then we see a Hammer-like black candlestick on the second day.
4. The lower shadow of the second day sets a new low.
5. Then we see a short white candlestick, which is below the second day candlestick.
Explanation:
With the Unique Three River Bottom bull pattern, we first see a long black stick in a falling market. The next day opens at a higher level, however bearish sentiment is strong causing a new low during the day however the day closes near the high thus producing a small black body within the body of the first day. This rally questions the strength of bears. The increasing uncertainty is further strengthened when the third day opens lower, but not lower than the low of the second day. There is some stability on the third day as evidenced by its small white body. Third day ends by a rally closing below the close of the second day. If price rises to new high on the fourth day, then a reversal of trend is confirmed.
Important Factors:
A confirmation on fourth day is advisable to show that that the downtrend has reversed. This may be in the form of a white candlestick, a large gap up or a higher close on the fourth day.
14. BULLISH BREAKAWAY

Type: Reversal
Relevance: Bullish
Prior Trend: Bearish
Reliability: Medium
Confirmation: Recommended
No. of Sticks: 5
Definition: There is a downtrend but we also see that the prices bottom out and level off now. The result is a long white candlestick that however does not close the initial downward gap of the first and second days. This suggests a short-term reversal.
Recognition Criteria:
1. Market is characterized by downtrend.
2. We see a long black candlestick in the first day.
3. Then we see a black candlestick on the second day with a gap below the first day.
4. Bearish mood continues on the third and fourth days as evidenced by lower consecutive closes.
5. Finally however, we see a long white candlestick on the fifth day characterized by a closing price inside the gap caused by the first and second days.
Explanation:
The Bullish Breakaway Pattern appears during a downtrend and it shows that selling accelerated to the point of an oversold market. It starts with a long black day then involves a gap in the direction of the downtrend followed by three consecutively lower price days. So far, all days in this pattern are black with the exception of the third day, which can be either be black or white. The three days after the gap are similar to the Three Black Crows pattern since their highs and lows are each consecutively lower. It is by now apparent that the downtrend has accelerated with a big gap and then starts to fizzle, however it still continues. There is an evident slow deterioration of the downtrend suggested by this pattern. Finally, we see a burst in the opposite direction, which completely recovers the previous three days' price action. The gap is not filled which points out to the weakness of the reversal. This is a short-term reversal.
Important Factors:
A confirmation on the sixth day is recommended in the form of a white candlestick, a large gap up or a higher close, to be sure about the reversal.
15. BULLISH LADDER BOTTOM
 Type: Reversal
Relevance: Bullish
Prior Trend: Bearish
Reliability: Medium
Confirmation: Suggested
No. of Sticks: 5
Definition: The Ladder Bottom is a five candle bullish reversal formation. The pattern occurs during a downtrend, with the first three candlesticks are black with successive lower opens and close. The fourth day is a black candle with only an upper wick. The fifth day is a white candlestick that opens above the body of the fourth.
Recognition Criteria:
1. Market is characterized by downtrend.
2. We see three long black candlesticks characterized by consecutively lower opens and a closing sequence just like the Bearish Three Black Crows Pattern.
3. Then we see a black candlestick on the fourth day with an upper shadow.
4. Finally we see a white candlestick opening above the body of the fourth day on the fifth day.
Explanation:
There is a considerable downtrend for some time and the bears are happy. Then we see a good move downward. Prices start trading above the opening price and almost reaching to the new high of the previous day, but then they close at another new low. This action is a warning for shorts telling them that the market will not go down forever. The shorts may then be forced to reevaluate their positions and they may start closing their positions on the next day if profits are good. This act is the reason behind the upward gap we see on the last day of the pattern and also the close is considerably higher. If volume is high on the last day, a trend reversal has probably occurred.
Important Factors:
A confirmation on the sixth day is suggested in the form a white candlestick, a large gap up or a higher close, to be sure that the market has reversed.
Note: The bullish Ladder Bottom is similar to the bullish Concealing Baby Swallow and bearish Three Black Crows.

