![[Valid Atom 1.0]](https://lh3.googleusercontent.com/blogger_img_proxy/AEn0k_sCOf2LZlGTKU-60x2IcDqSx_z9It9tYp08fYb7tOKQvcjHcW4cwk8ipkIVXeq445QLPBc6XNpjj00l75x3j7_8a-1hN_BRginbOPSc_JAZ5QQ=s0-d "Validate my Atom 1.0 feed")
Bullish Low Reliability Reversal Candle Patters

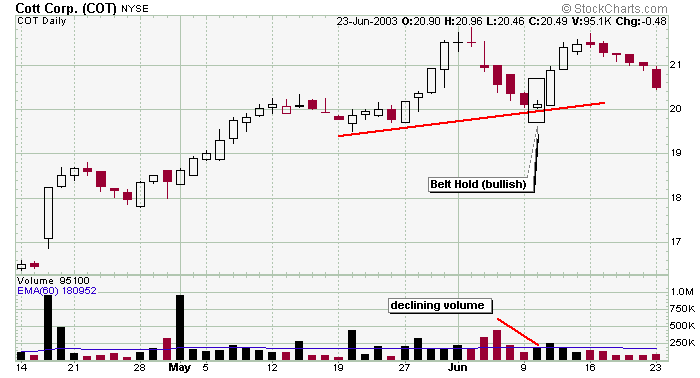
1. BULLISH BELT HOLD PATTERN

BULLISH BELT HOLD PATTERN
Type: Reversal
Relevance: Bullish
Prior Trend: Bearish
Reliability: Low
Confirmation: Required
Definition:
The Bullish Belt Hold Pattern is a single candlestick pattern. It is basically a White Opening Marubozu that occurs in a downtrend. As such; it opens on its low, then we see a rally during the day against the overall trend of the market, and then the day closes near its high but not necessarily at its high. If Belt Hold lines are characterized by longer bodies, then it means that they offer more resistance to the trend they are countering.
Recognition Criteria:
1. There must be an overall downtrend in the market.
2. The day gaps down, and the market opens at its low but then prices go up during the day and they close near to the day’s high.
3. We see a white body that has no lower shadow that is a White Opening Marubozu.
2. The day gaps down, and the market opens at its low but then prices go up during the day and they close near to the day’s high.
3. We see a white body that has no lower shadow that is a White Opening Marubozu.
Explanation:
The market starts the day with a significant gap in the direction of prevailing downtrend. So the first impression reflected in the opening price is continuation of the downtrend. However; then the things change rapidly and the following price action of the day is the opposite of the previous trend. This obviously causes much concern among some shorts and leads to covering of many short positions. This accentuates the reversal and it may signify a rally for the bulls.
Important Factors:
The trend reversal implied by Bullish Belt Hold pattern requires further confirmation in the form of either a white candlestick, a large gap up or a higher close on the next trading day.
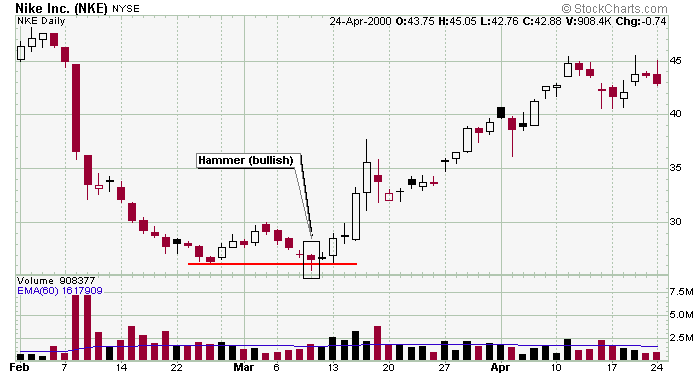
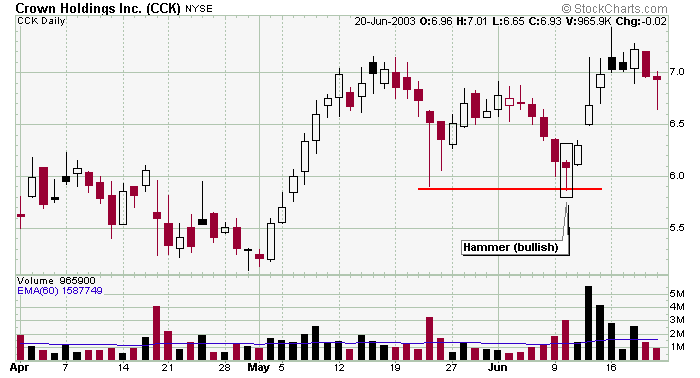
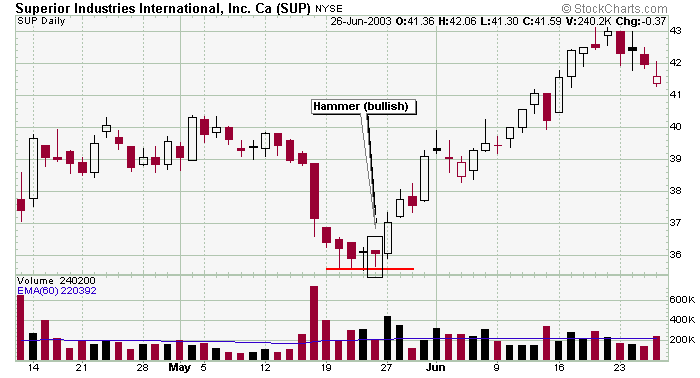
2. BULLISH HAMMER
 BULLISH HAMMER
Type: Reversal
Relevance: Bullish
Prior Trend: Bearish
Reliability: Low
Confirmation: Definitely required
Definition:
The Bullish Hammer Pattern is a significant candlestick that occurs at the bottom of a trend or during a downtrend and it is called a hammer since it is hammering out a bottom. The Bullish Hammer Pattern is a single candlestick pattern and it has a strong similarity to the Bullish Dragonfly Doji Pattern. In the case of Bullish Dragonfly Doji Pattern, the opening and closing prices are identical whereas the Bullish Hammer Pattern has a small real body at the upper end of the trading range.
Recognition Criteria:
1. The market is characterized by a prevailing downtrend.
2. Then we see a small real body at the upper end of the trading range. Color of this body is not important.
3. We would like to see the lower shadow at least twice as long as the real body.
4. There is no (or almost no) upper shadow.
2. Then we see a small real body at the upper end of the trading range. Color of this body is not important.
3. We would like to see the lower shadow at least twice as long as the real body.
4. There is no (or almost no) upper shadow.
Explanation:
The overall direction of the market is bearish, characterized by a downtrend. Then the market opens with a sharp sell off implying the continuation of the downtrend. However, prices suddenly turn upwards, the sell-off is quickly abated and bullish sentiment continues during the day with a closing price at or near to its high for the day which causes the long lower shadow. Apparently the market fails to continue in the selling side. This observation reduces the previous bearish sentiment causing the short traders to feel increasingly uneasier with their bearish positions.
Important Factors:
If the hammer is characterized by a close above the open thus causing a white body, the situation looks even better for the bulls.
The Bullish Dragonfly Doji pattern is generally considered more bullish than the Bullish Hammer Pattern and a higher reliability is ascribed to this Doji than the Bullish Hammer Pattern.
The reliability of Bullish Hammer Pattern is low. It requires confirmation of the implied trend reversal by a white candlestick, a large gap up or a higher close on the next trading day.
3. BULLISH INVERTED HAMMER

Type: Reversal
Relevance: Bullish
Prior Trend: Bearish
Reliability: Low
Confirmation: Definitely required
Definition:
Bullish Inverted Hammer Pattern is a candlestick characterized by a long upper shadow and a small real body preceded by a long black real body. It is similar in shape to the Bearish Shooting Star. The shooting star appears in a downtrend and thus it becomes a potentially bullish inverted hammer.
Recognition Criteria:
1. Market is currently characterized by downtrend.
2. The first day of the pattern is a black candlestick formed at the lower end of the trading range.
3. The second day of the pattern is a small real body and is formed at the lower end of the trading range.
4. The color of the second real body is not important, however the color of the body is black in the first day.
5. No gap down is required, as long as the pattern is seen after a downtrend.
6. Upper shadow of the second small body should be at least twice as long as the real body.
7. The second body does not have lower shadow or it has only a very little lower shadow.
Explanation:
Bullish Inverted Hammer Pattern occurs in a bearish background. In a day of inverted hammer, market opens at or near its low. Then prices change direction and we see a rally. However the bulls cannot succeed to sustain the rally during the rest of the day and prices finally close either at or near the low of the day. It may not be clear why this type of price action is interpreted as a potential reversal signal. The answer has to do with what happens over the next day. If the next day opens above the real body of the inverted hammer, it means that those who shorted at the opening or closing of the inverted hammer day are losing money. The longer the market holds above the inverted hammer’s real body, the more likely these shorts will attempt to cover their positions. This may ignite a rally as a result of covered short positions, which may then inspire the bottom pickers to take long positions.
Important Factors:
Bullish verification on the day following the inverted hammer is required. This verification can be in the form of the next day opening above the inverted hammer’s real body. The larger the gap the stronger the confirmation will be. A white candlestick with higher prices can also be another form of confirmation.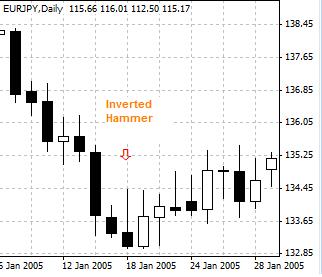
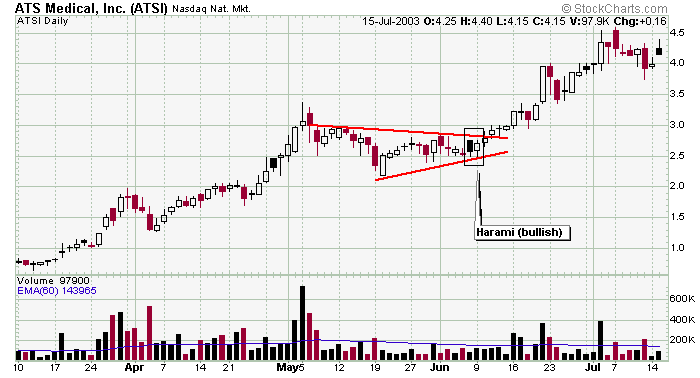
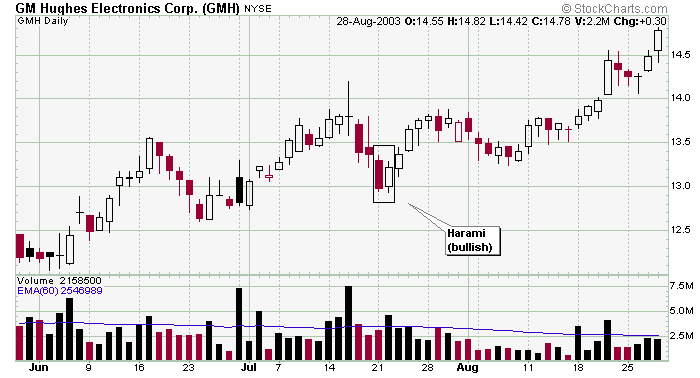
4. BULLISH HARAMI
BULLISH HARAMI
 Type: Reversal
Relevance: Bullish
Prior Trend: Bearish
Reliability: Low
Confirmation: Strongly suggested
Definition:
Bullish Harami Pattern is characterized by a small white real body contained within a prior relatively long black real body. “Harami” is an old Japanese word for “pregnant”. The long black candlestick is “the mother” and the small candlestick is “the baby”.
Recognition Criteria:
1. The market is in a bearish mood characterized by downtrend.
2. Then we see a long black candlestick.
3. We see a white candlestick on the following day where the small white real body is completely engulfed by the real body of the first day. The shadows (high/low) of the second candlestick are not necessarily contained within the first body, however it's preferable if they are.
Explanation:
The Bullish Harami Pattern is a sign of disparity about the market’s health. While the market is characterized by downtrend and bearish mood; there is heavy selling reflected by a long, black real body however it is followed by a small white body in the next day. This may signal a trend reversal since the second day’s small real body shows that the bearish power is diminishing.
Important Factors:
The decisive fact about this pattern is that the second candlestick has a minute real body relative to the prior candlestick. Furthermore this small body is completely inside the larger one. The Bullish Harami Pattern does not necessarily imply that a rally will follow. Market usually enters into a congestion phase following the Bullish Harami.
We may need a third day confirmation to be sure that the downtrend has really reversed. This confirmation of the trend reversal may be signaled by a white candlestick, a large gap up or by a higher close on the third day.