![[Valid Atom 1.0]](https://lh3.googleusercontent.com/blogger_img_proxy/AEn0k_uRpARQokbKfUZNB-qlJXRfb-6s12yQ2jX8xhUsgA9e_9lhXZVYW1XOXuz3tyZHVmSIoCRqXYm1J6q44kqugg4vCVQvj0QtufH6e_HekdGuqfQ=s0-d "Validate my Atom 1.0 feed")
Bearish High Reliability Reversal Candlestick Patterns
1) Bearish Dark Cloud Cover, 2) Bearish Kicking, 3) Bearish Abandoned Baby,
4) Bearish Evening Star, 5) Bearish Three Black Crows, 6) Bearish Three Inside Down, 7) Bearish Three Outside Down, 8) Upside Gap Two Crows.
1. Bearish Abandoned Baby

Pattern: reversal
Reliability: high
Identification
A long white day is followed by a Doji that gaps in the direction of the trend. Then a black day occurs gaping in the opposite direction with no overlapping shadows.
Reliability: high
Identification
A long white day is followed by a Doji that gaps in the direction of the trend. Then a black day occurs gaping in the opposite direction with no overlapping shadows.
The Psychology
In an uptrend or within a bounce of a downtrend, the market gaps up but does not continue it's upward movement. Instead enough bears step in to bring supply and demand back into equilibrium and the stock churns in place. This isn't necessarily bearish, but it's certainly less bullish. The pattern is confirmed by the next day's gap down and drop.
The bearish Abandoned Baby formation doesn't occur too often and is similar to the bearish Doji Star, bearish Evening Star, and bearish Evening Doji Star.
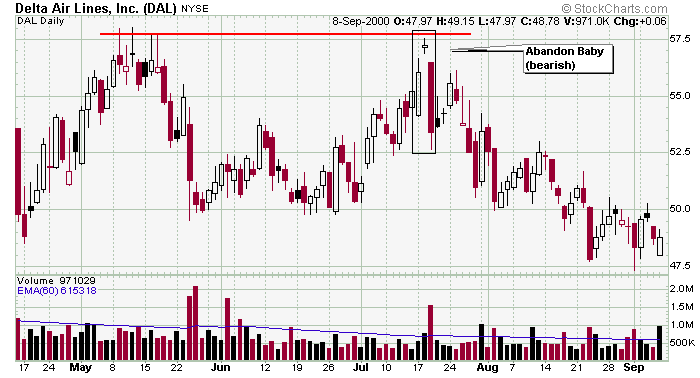
If you can handle the volatility, DAL provided a decent entry on a short when the stock formed a bearish Abandoned Baby formation at resistance. If this pattern had formed in a steady uptrend, it would be very risky, but given that it formed at a previous high, the reliability of the pattern increases.
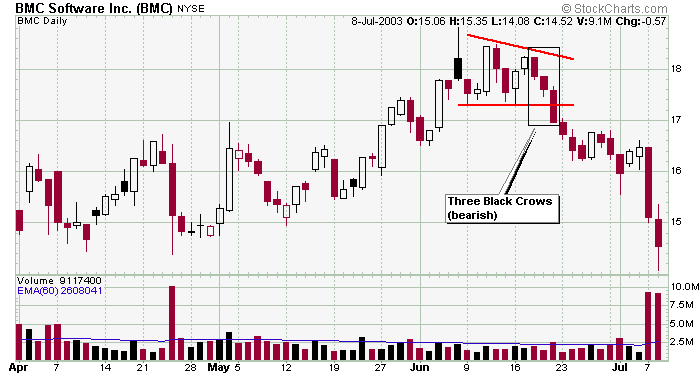
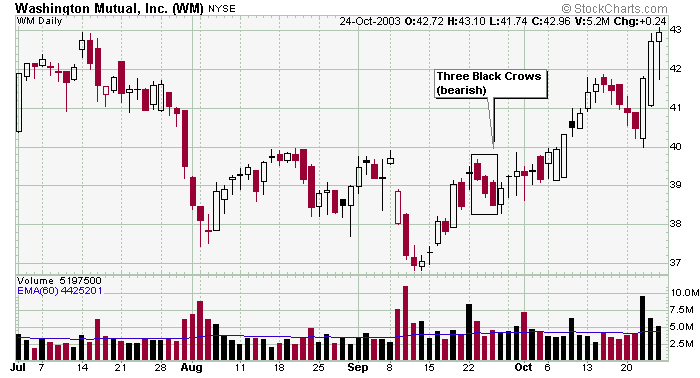
2. Bearish Three Black Crows
 Pattern: reversal
Reliability: high
Identification
Three long black days occur with each successive open being within the body of the previous day and each successive close being below the previous day's and near the day's low.
The Psychology
In an uptrend or within a bounce of a downtrend, the three long black candles speak for themselves. If volume accompanies the move, the reliability of the pattern increases significantly.
The bearish Three Black Crows is similar to the bearish Identical Three Crows, bullish Concealing Baby Swallow, bullish Ladder Bottom and bullish Three Stars in the South and could be the beginning of the bearish Three Line Strike.
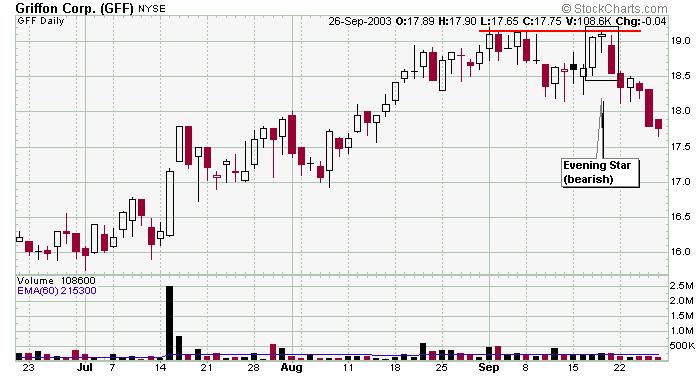
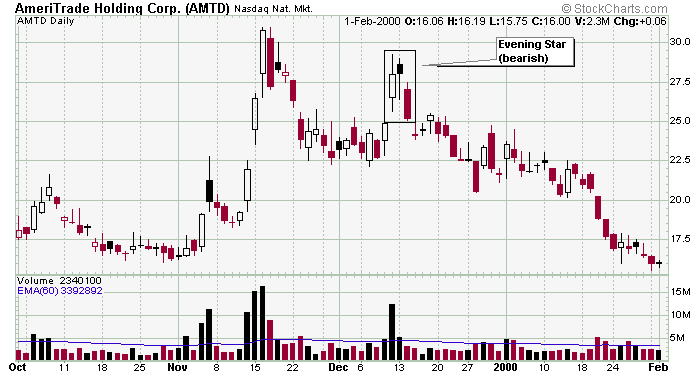
3. Bearish Evening Star
 Pattern: reversal
Reliability: high
Identification
A long white day is followed by a small body that gaps in the direction of the trend. The third day is a black day that closes in the bottom half of the white candle.
The Psychology
In an uptrend or within a bounce of a downtrend, the market gaps up but does not continue its upward movement. Instead enough bears step up to bring supply and demand back into equilibrium so a small body forms. A subsequent follow through gap down that closes below the midpoint of the white day completes the pattern and confirms the reversal.
The bearish Evening Star is similar to the bearish Evening Doji Star, bearish Abandoned Baby, bearish Doji Star, bearish Two Crows, and bearish Upside Gap Two Crows.
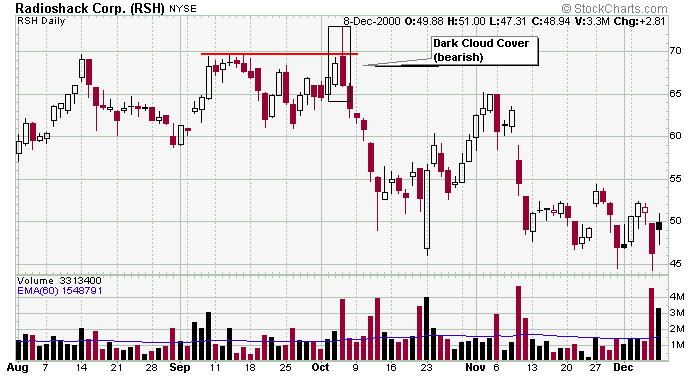
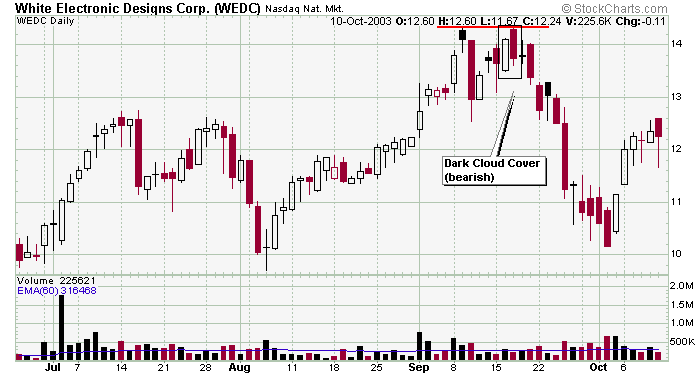
4. Bearish Dark Cloud Cover
 Pattern: reversal
Reliability: high
Identification
A long white day is followed by a black day which gaps above the high of the white candle and then closes below the midpoint of the first day's body.
The Psychology
In an uptrend or within a bounce of a downtrend, the stock gaps up and immediately encounters sellers who push the stock back down. This simply signifies the possibility of a reversal that is more reliable if the gap up occurs at resistance and the black day is accompanied by a surge in volume.
The bearish Dark Cloud Cover is similar to the bearish Engulfing.
 Pattern: reversal Reliability: high
 Identification
A White Marubuzo (opens at low and closes at high) is followed by a Black Marubuzo (opens at high and closes at low) that gaps down.
The Psychology
A big black candle that opens at its high and closes at the day's low is bearish regardless of the overall trend. Volume confirmation on the black day solidifies the patter as is a follow up weak day.
The bearish Kicking is similar to the bearish Separating Lines.

6. Bearish Three Inside Down
 Pattern: reversal Reliability: high
 Identification
A bearish Harami pattern is followed by a black day whose close is lower than the second day.
The Psychology
In an uptrend or within a bounce of a downtrend, a bearish Harami forms. By itself this pattern has moderate reliability as a reversal pattern, but when followed by a weak day (preferably with a pick up in volume) the overall pattern becomes much more reliable.
The bearish Three Inside Down is a continuation of the bearish Harami.
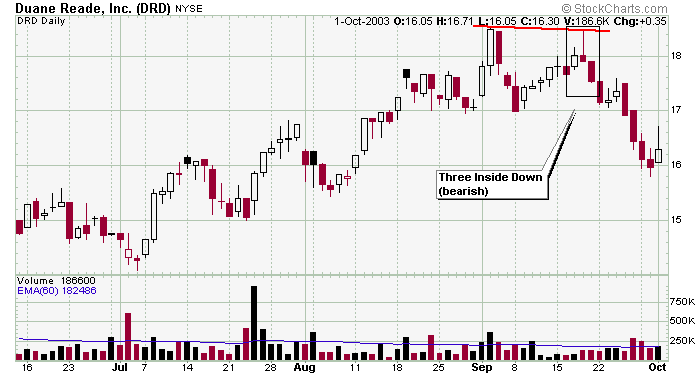 DRD was in a steady uptrend, but the mid-September attempt at a higher high failed and resulted in a bearish Three Inside Down candle formation which reversed the uptrend.
 Look below chart SFD collapsed on huge volume in late June. The stock then experienced an oversold bounce which ended in a bearish Three Inside Down pattern.

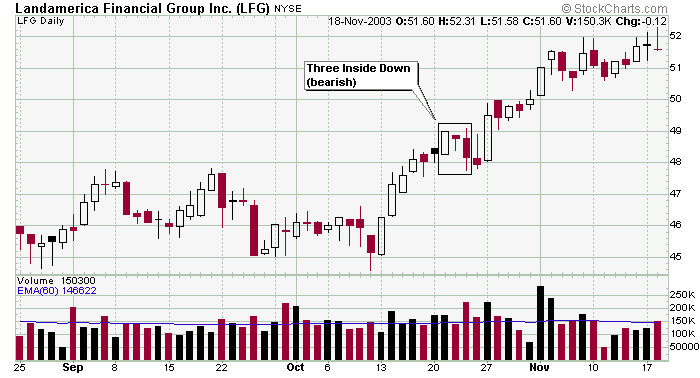
Here is an example of when not to play a bearish Three Inside Down formation. LFG has just made a higher high on better than average volume. The candle pattern was just a pause in an uptrend...not a reason to go short.
7. Bearish Three Outside Down
 Pattern: reversal
Reliability: high
Identification
A bearish Engulfing pattern is followed by a black day whose close is lower than the second day.
In an uptrend or within a bounce of a downtrend, a bearish Engulfing pattern forms. By itself this pattern has moderate reliability as a reversal indicator, but when the it is followed by another black day (preferably on strong volume), the overall pattern becomes much more reliable.
The bearish Three Outside Down is a continuation of the bearish Engulfing.
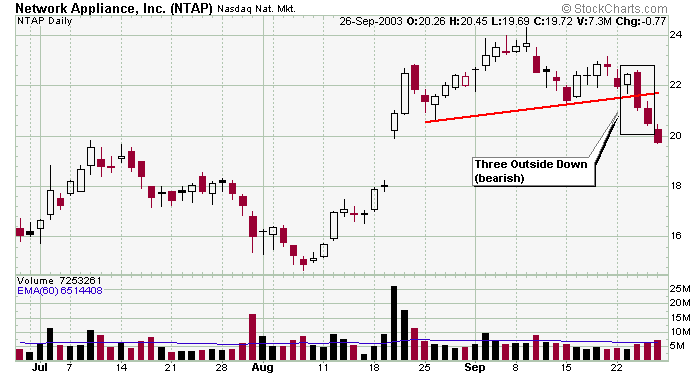
Here is another reliable scenario. Although NTAP was in a decent uptrend, the stock formed a bearish Three Outside Down pattern and broke support at the same time. That's a nice one-two punch.
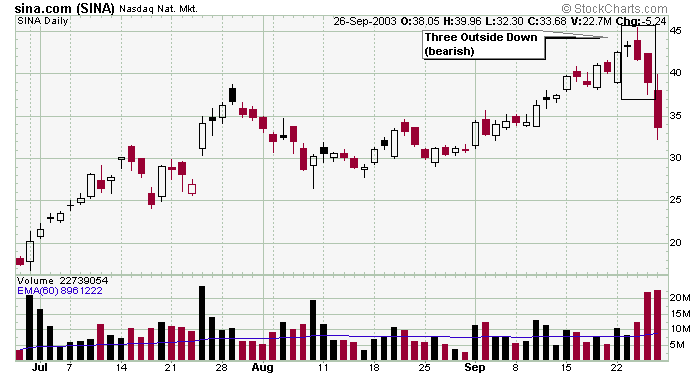
SINA is an example of the riskiest way to play this formation. The stock was generally in a good uptrend with no noticeable resistance nearby. The Three Outside Down pattern did mark the end of the rally, but given the lack of overhead resistance, it was a riskier play.
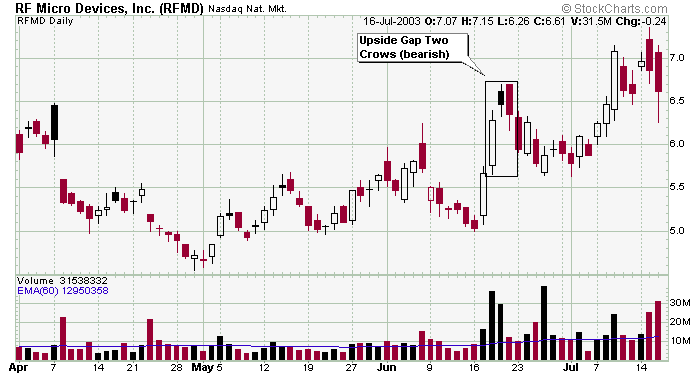
8. Bearish Upside Gap Two Crows
 Pattern: reversal
Reliability: high
Identification
A long white day is followed by a black candle which gaps in the direction of the trend. The final day engulfs the small black day and closes within the gap of the first two days.
In an uptrend or within a bounce of a downtrend, successive gaps up which close down to force a black candle to form suggests the bulls are weaken. They are not able to rally the stock intraday and the bears are starting to take over. The reliability of the increases if the gaps up bump into resistance.
The bearish Upside Gap Two Crows is similar to the bearish Two Crows and bearish Evening Star.